Visualizing Momentum: The Power of the Color RSI Indicator for MT5
In the fast-paced world of Forex trading, the ability to interpret market sentiment at a glance can be the difference between a winning trade and a missed opportunity. While the standard Relative Strength Index (RSI) is a staple in technical analysis, it often requires extra mental effort to determine when price has crossed critical thresholds. The Color RSI indicator for MetaTrader 5 (MT5) solves this by adding a dynamic visual layer to momentum analysis, allowing traders to identify overbought, oversold, and trend-neutral conditions instantly.
What is the Color RSI Indicator?
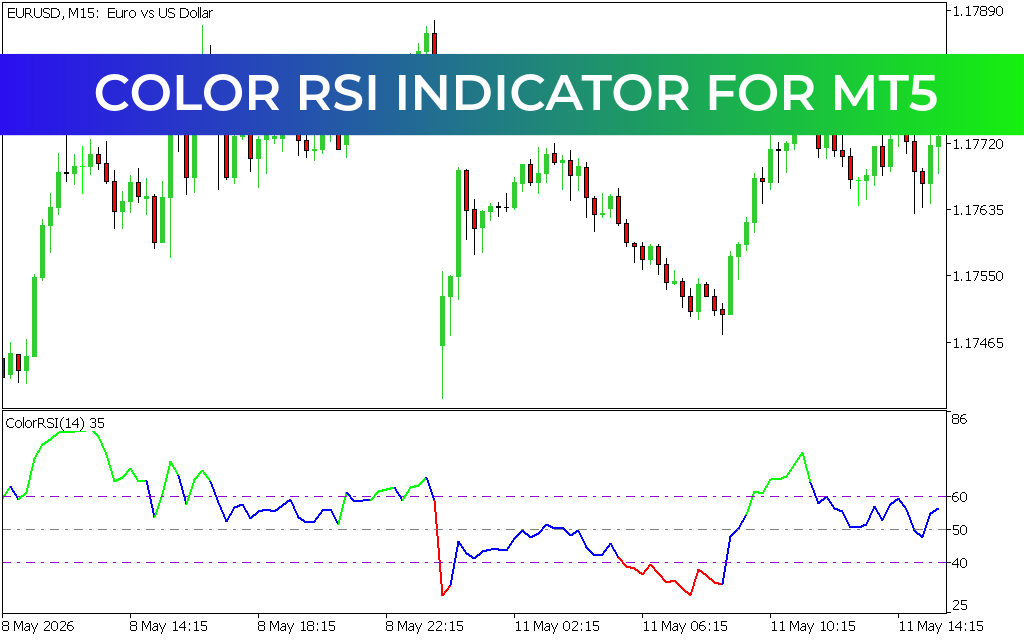
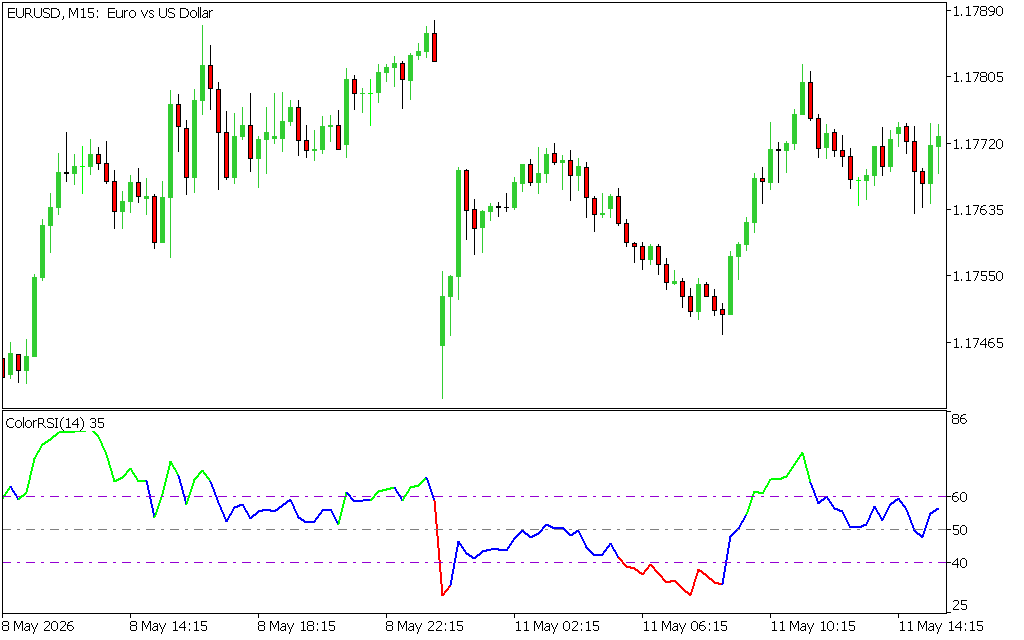
The Color RSI is a visual enhancement of the traditional RSI oscillator. While the underlying calculation—measuring the speed and change of price movements—remains the same, the output is transformed. Instead of a single, monochromatic line, the Color RSI changes color based on its position relative to user-defined levels (typically 30, 50, and 70).
On an MT5 chart, this usually translates to:
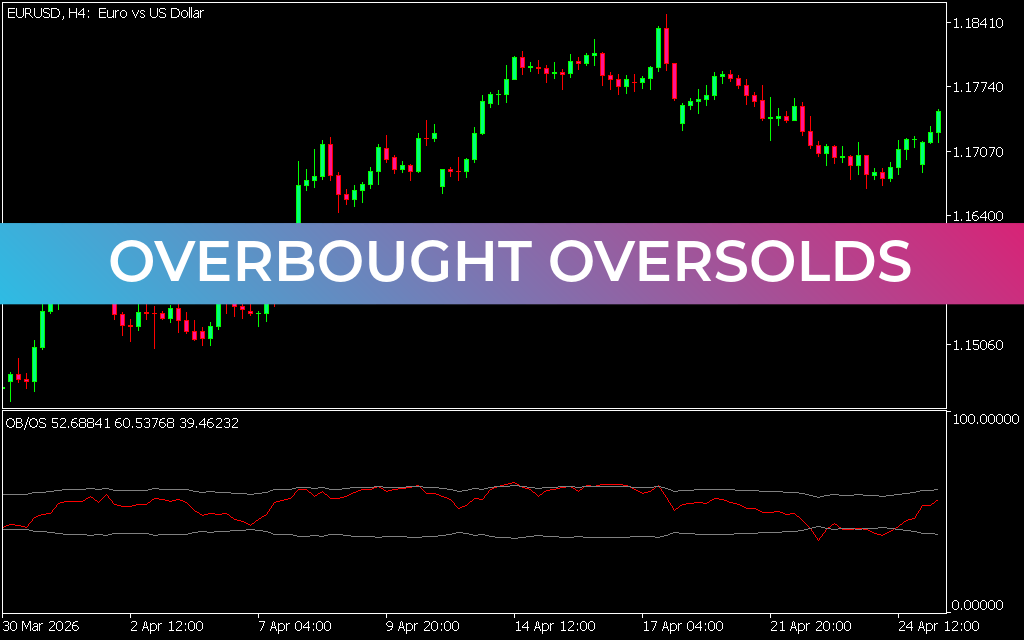
- Green: The RSI is above 60 or 70, indicating strong bullish momentum or overbought conditions.
- Red: The RSI is below 40 or 30, signaling intense bearish pressure or oversold conditions.
- Blue/Gray: The RSI is in the neutral zone (near 50), indicating a lack of clear trend or market consolidation.
Why Every MT5 Trader Needs It
The transition to MetaTrader 5 brought superior charting capabilities, and the Color RSI leverages this to provide a more intuitive trading experience:
- Instant Psychological Clarity: Human brains process color faster than numerical data. By seeing a color flip, you are alerted to momentum shifts without needing to squint at the sub-window scale.
- Enhanced Divergence Spotting: Spotting bullish or bearish divergence becomes much easier when the peaks and troughs are color-coded, helping you identify potential reversals before they happen.
- Reduced Analytical Fatigue: For day traders and scalpers who monitor multiple charts, the color-coded system drastically reduces the cognitive load required to assess market bias.
- Customizable Thresholds: MT5 allows for deep customization, meaning you can set your color triggers to match your specific strategy, whether you are a conservative swing trader or an aggressive scalper.
Strategy: Trading the Momentum Shift
Using the Color RSI on MT5 allows for a simple yet highly effective "Trend Re-entry" strategy:
- Establish the Bias: Look at a higher timeframe to see the dominant trend.
- The Pullback: In an uptrend, wait for the Color RSI on your trading timeframe to turn red (oversold).
- The Trigger: Enter a "Buy" position the moment the RSI turns back to blue or green, signaling that the temporary dip is over and the main trend is resuming.
- The Exit: Stay in the trade until the color reaches the opposite extreme or begins to flatten out in the neutral zone.
Conclusion
The Color RSI indicator for MT5 is a definitive upgrade for any technical trader. It takes the proven reliability of the Relative Strength Index and modernizes it for a high-speed trading environment. By distilling complex momentum data into simple visual cues, it empowers you to make faster, more objective, and ultimately more profitable trading decisions.
10 Downloads
Last Update:
May 14, 2026 16:40 PM
Published:
Jan 22, 2026 12:14 PM
Category: