Navigating Extreme Market Zones with the Overbought Oversold Indicator
In technical financial analysis, pinpointing the precise moments when an asset has traveled too far, too fast is a foundational pillar of profitable trading. When buying or selling pressure reaches unsustainable extremes, markets inevitably pause, consolidate, or undergo a sharp Trend Reversal. The Overbought Oversold (OB/OS) indicator is engineered specifically to identify these critical inflection points, providing traders with an objective, data-driven framework for anticipating key market pivots.
What is the Overbought Oversold Indicator?
The Overbought Oversold indicator is an advanced mathematical oscillator optimized for MetaTrader platforms. It measures the relative velocity and magnitude of recent price movements to determine whether a currency pair or CFD is trading outside its normal statistical equilibrium.
Unlike basic oscillators that use fixed, rigid lines, this technical tool features dynamic boundaries that adjust organically to market conditions. By plotting an intuitive signal line within a structured mathematical band, the indicator helps technical analysts filter out intraday noise, preventing them from buying at the absolute top of a market cycle or selling at the absolute bottom.
How to Read the Visual Extremes
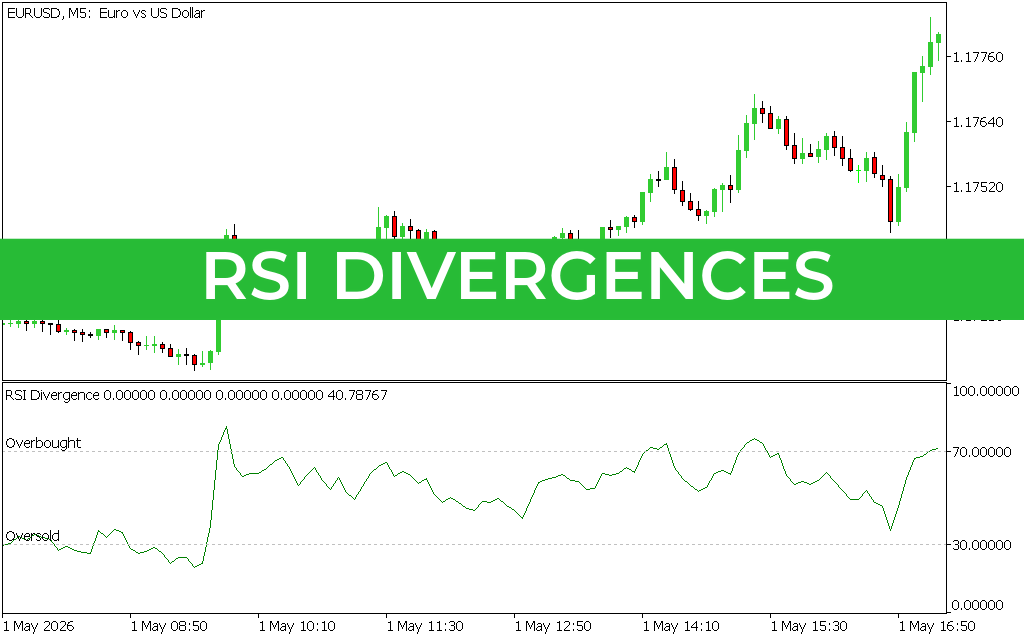
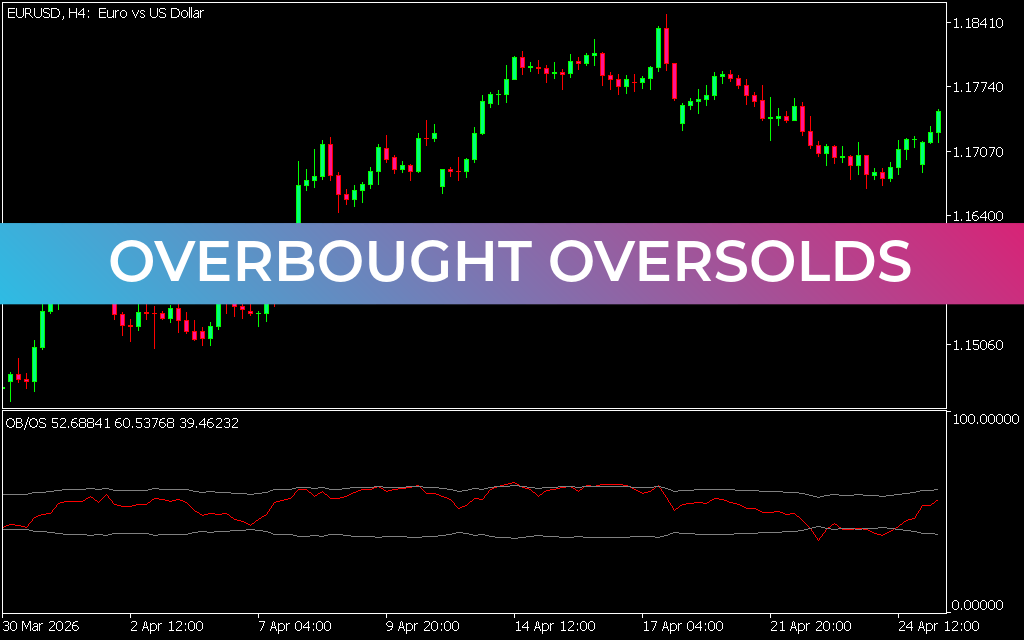
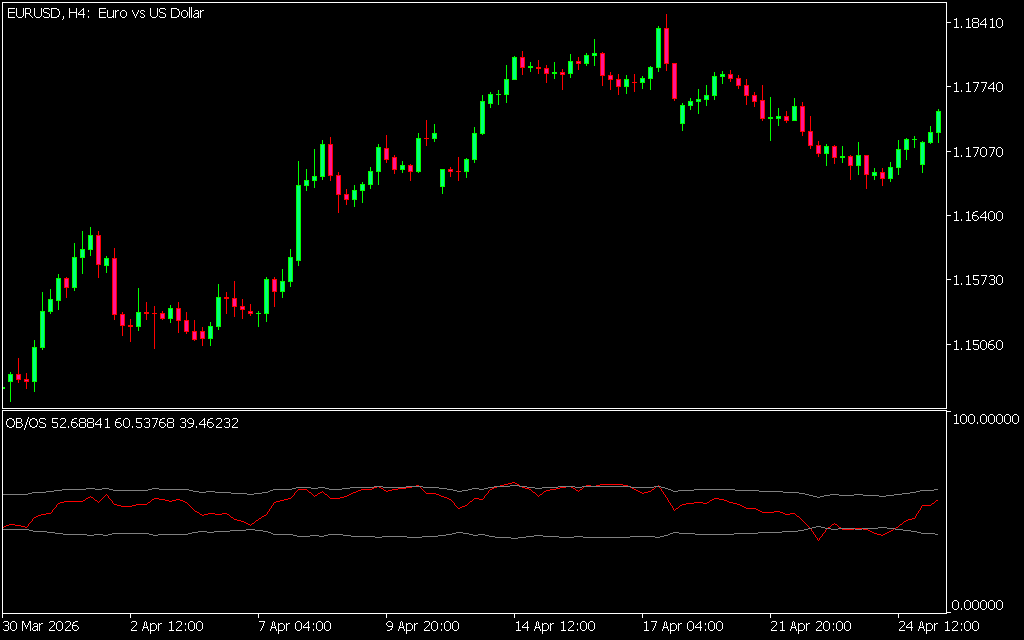
As demonstrated on the 4-hour (H4) chart for the EUR/USD pair, the Overbought Oversold indicator occupies a dedicated sub-window below the primary price feed, tracking market sentiment on a scale from $0.00000$ to $100.00000$:
- The Overbought Region (Upper Band): When the solid red signal line climbs and pushes against or breaks through the upper dynamic boundary, the asset enters an overbought state. This signals that the prevailing upward momentum is overextended and a downward retracement or corrective phase is highly likely.
- The Oversold Region (Lower Band): Conversely, when aggressive selling pressure drives the red signal line down to test or breach the lower dynamic boundary, the market is considered oversold. This suggests that selling momentum is exhausting, opening the door for buyers to step in.
- Mid-Range Consolidation: When the signal line oscillates calmly between the two bands, it reflects a balanced market state or a strong, stable trend, advising traders to look for continuation setups rather than structural reversals.
Professional Trading Strategies
To maximize the performance of the Overbought Oversold indicator, it should be integrated into a rule-based execution strategy:
- Trend Confluence: Avoid trading counter-trend signals blindly. If the higher-timeframe Market Structure is strongly bullish, ignore overbought signals and use oversold dips on lower timeframes as high-probability buying opportunities.
- Band Rejection Setups: Wait for the red signal line to cross back inside the dynamic bands after an extreme extension. A clean cross back below the upper band serves as an active validation trigger for short-selling or profit-taking.
By removing guesswork from market extremes, the Overbought Oversold indicator acts as an indispensable visual guide to institutional value areas.
3 Downloads
Last Update:
May 21, 2026 02:29 AM
Published:
Jan 18, 2026 14:05 PM
Category: