Mastering Market Cycles with the DPO Indicator for MT5
In the modern financial markets, identifying the underlying rhythm of price movement is a cornerstone of successful technical analysis. Most classic momentum tools—such as moving averages or standard MACD lines—suffer from an inherent flaw: mathematical lag. By trying to smooth out Price Action over time, they often alert traders to a trend or reversal long after the optimal entry point has passed. The DPO (Detrended Price Oscillator) indicator for MT5 eliminates this issue by completely isolating short-term market cycles from broader macro trends.
What is the Detrended Price Oscillator (DPO)?
The Detrended Price Oscillator is a specialized technical analysis tool engineered to remove the long-term trend component from price data, making it vastly easier to identify short-term cycles, overbought/oversold regions, and clear turning points. While standard oscillators compare current closing prices to historical moving averages, the DPO shifts its baseline backwards in time.
By comparing a historical closing price to a shifted simple moving average (SMA), the indicator effectively eliminates the price trends that span across multiple weeks or months. This mathematical adjustment isolates the repeating, structural waves of the market, allowing traders to precisely measure the distance between cyclical peaks and troughs.
The basic formula behind the calculation can be expressed as:
$$\text{DPO} = \text{Price}\left(\frac{N}{2} + 1\right) \text{ periods ago} - \text{SMA}(N)$$
Where $N$ represents the user-defined lookback or cycle period.
Interpreting the Visual Cues on Your Chart
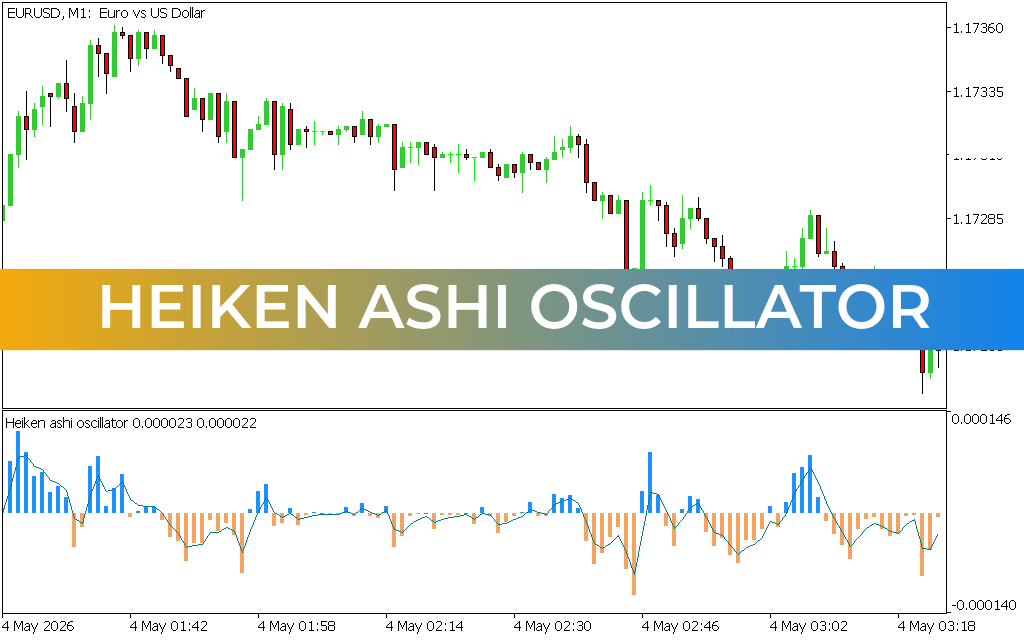
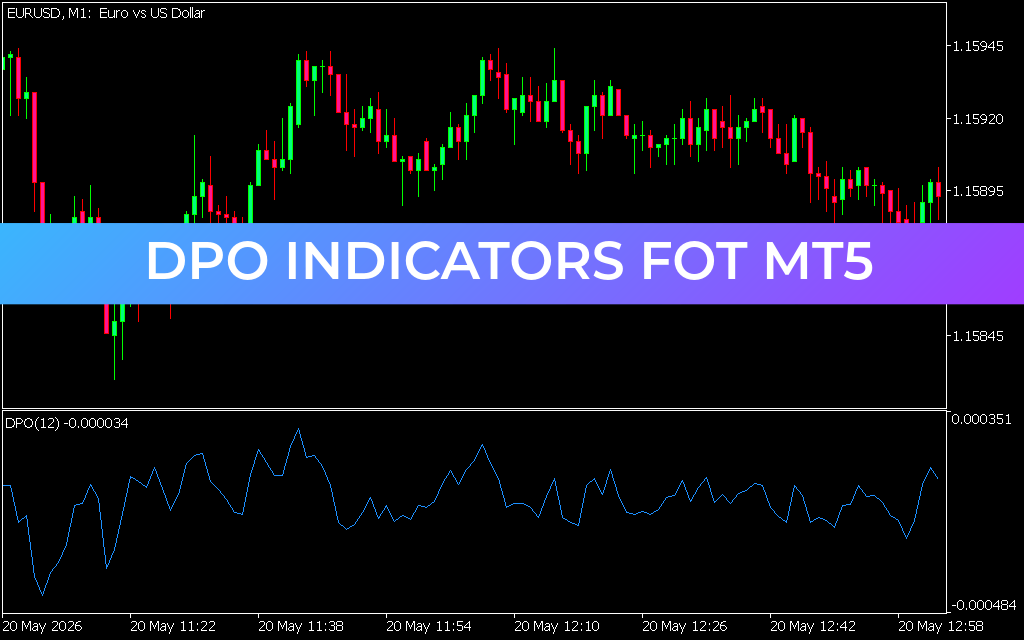
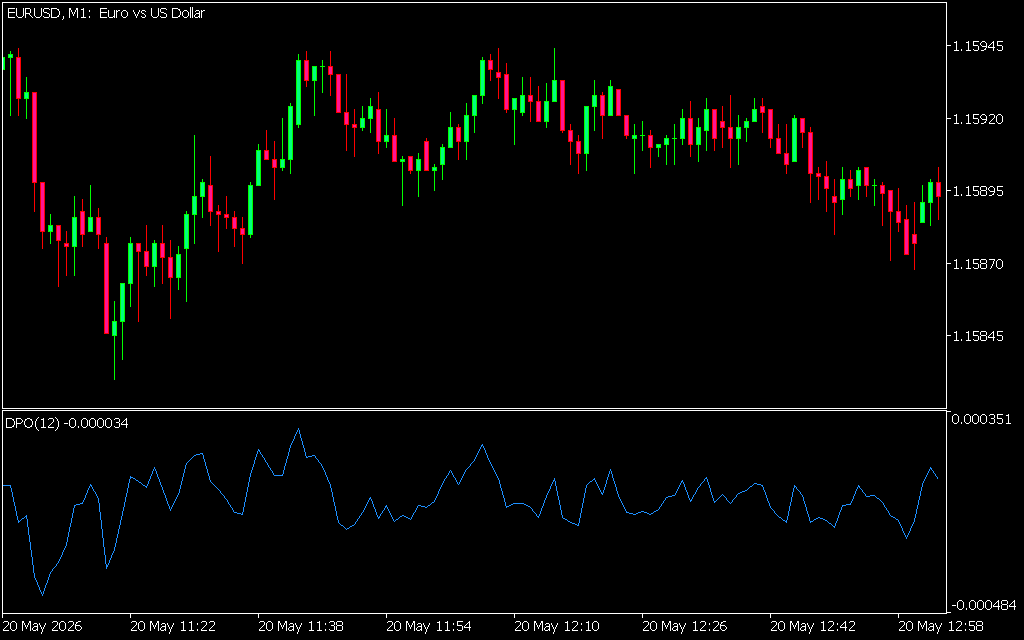
When loaded onto a 1-minute (M1) or 5-minute (M5) intraday chart on the MetaTrader 5 platform, the DPO populates a clean, standalone sub-window beneath the main price grid. The indicator consists of a highly responsive, single oscillator line moving fluidly around a central zero-line equilibrium.
- Cyclical Peaks (Overbought Zones): When the blue DPO line advances rapidly and peaks high above the central zero line, it signals that the short-term cycle is reaching an overextended, overbought state. This alerts day traders to look for bearish price action signals or to tighten stop-losses on running long positions.
- Cyclical Troughs (Oversold Zones): Conversely, when the line plunges deep below the zero baseline and bottoms out, it highlights an oversold cycle trough. This serves as a primary warning that selling momentum is exhausting and a high-probability upward bounce is near.
- The Zero-Line Baseline: The midline represents a point of temporary market equilibrium. A clean crossover above the zero line confirms that short-term cyclical velocity is turning bullish, while a cross below warns of expanding bearish pressure.
Professional Strategic Applications
To gain a statistical edge using the DPO indicator for MT5, implement it as a core component of a broader trading framework:
- Cycle Duration Measurement: Count the exact number of bars between consecutive peaks or troughs in the DPO window. This allows you to forecast precisely when the next structural cycle turn is mathematically scheduled to occur in the live market.
- Trend Confluence Filtering: Always check the macro Market Structure on higher timeframes (like H1 or H4). If the larger trend is bullish, ignore upper peak extensions and look exclusively to buy the deep oversold troughs when the DPO line crosses back above the zero line.
By removing the distorting effects of long-term trends, the DPO indicator clarifies raw market structure, keeping you ahead of turning points with clockwork precision.
1 Download
Last Update:
May 21, 2026 02:43 AM
Published:
Jan 18, 2026 13:44 PM
Category: