Mastering Momentum Shifts: Trading Intraday Waves with the RSI Inverse Fisher Transform Indicator
The Relative Strength Index (RSI) is widely recognized as one of the most reliable oscillators in technical analysis. However, retail traders often struggle with its traditional layout on lower-interval charts, where the indicator line frequently wanders aimlessly in neutral territory, generating lagging or ambiguous signals during fast-moving market segments. The RSI Inverse Fisher Transform Indicator for MT4/MT5 remedies this structural limitation. By applying John Ehlers' advanced Inverse Fisher Transform formula to a smoothed baseline RSI, this tool forces values to track aggressively toward clear overbought or oversold boundaries, providing day traders and high-frequency scalpers with crisp, decisive turning points.
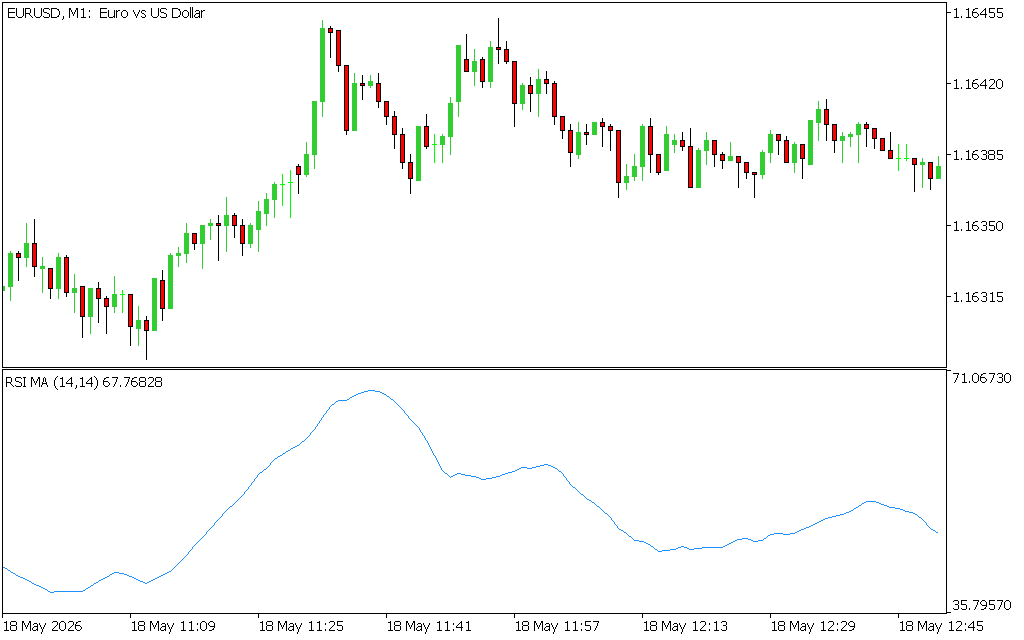
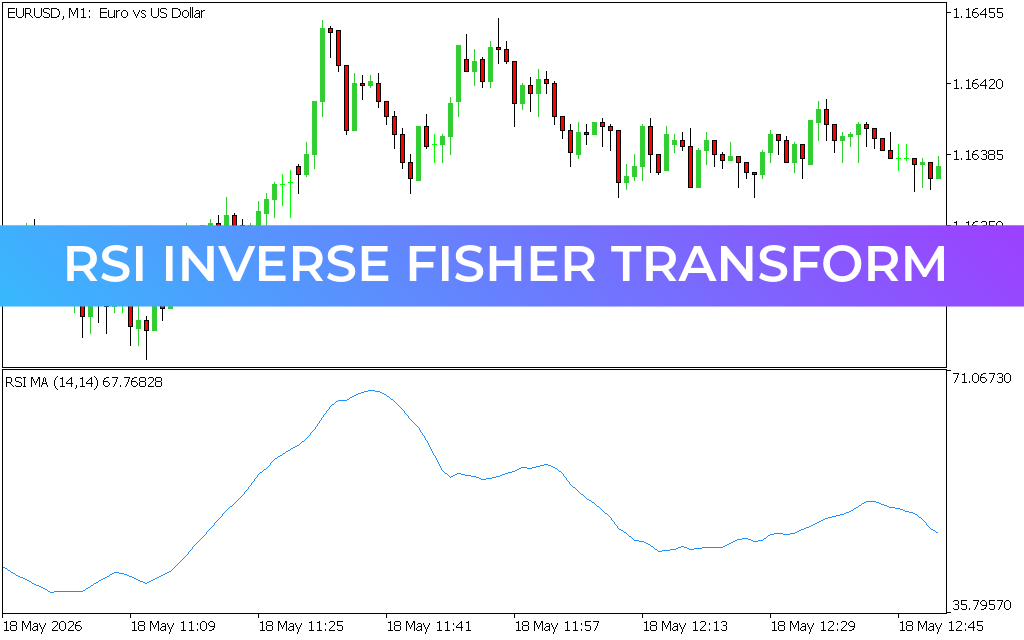
Decoding Structural Extremes on the EUR/USD M1 Chart
The provided EUR/USD 1-minute (M1) chart showcases the profound analytical clarity this indicator delivers during rapid intra-day Scalping sessions. Located in the bottom sub-window, the indicator transforms standard drifting lines into a stark, square-wave mathematical profile oscillating between $-1.0$ and $+1.0$, with a critical neutral baseline fixed at $0.00$.
During the early morning session of May 18, the asset entered a pronounced, choppy consolidation zone before initiating a steep markdown phase down past the 1.16330 region. In a standard setup, lagging oscillators trap traders into late entries.
Notice how the RSI Inverse Fisher Transform engine reacts to the selling pressure: it drops cleanly into a tight, flat-lined posture right against the lower $-1.0$ boundary. This structural flattening serves as a powerful alert. It informs traders that while the market is technically overextended, the bearish velocity is locked in. The real execution signal occurs the exact moment the line ruptures this boundary and crosses decisively back above the $0.00$ center line, confirming that institutional accumulation has commenced.
Precision Scalping and Objective Exit Optimization
The true tactical edge of the RSI Inverse Fisher Transform indicator lies in its lightning-fast response times at the birth of structural trend rotations. Following a sharp multi-pip slide, the currency pair established a definitive V-shaped reversal base near 1.16260.
As aggressive buyers stepped into the market, driving a rapid upward expansion back toward the 1.16370 liquidity pool, the indicator lines inside the sub-window surged in perfect synchronization. The rapid transition from the extreme oversold shelf up past the $0.00$ threshold provides an immediate, objective buy signal for high-frequency scalpers. This breakout perfectly captures the vertical markup leg with minimal drawdown.
Risk management becomes completely rule-based with this tool. Because the indicator cuts through mathematical variance to stay pinned at extremes until momentum truly shifts, day traders can establish tight invalidation stops just beneath the localized swing low. Profits can be locked in with absolute precision as the indicator reaches the upper $+1.0$ overbought boundary and begins to roll back downward. By implementing this institutional-grade smoothing algorithm, you eliminate ambiguity from your trading platform, maximize execution speed, and capture short-term price waves with absolute confidence.
2 Downloads
Last Update:
May 18, 2026 16:50 PM
Published:
Jan 19, 2026 21:37 PM
Category: