Mastering Momentum with the Color Zero Lag Trix Osma Indicator
In technical analysis, momentum oscillators are vital tools for identifying trend reversals, market strength, and potential entry points. However, standard oscillators often suffer from a frustrating flaw: lag. By the time a traditional moving average or Momentum Indicator signals a change in direction, a significant portion of the price move has already passed. The Color Zero Lag Trix Osma indicator addresses this fundamental problem by combining advanced smoothing techniques to deliver rapid, visually intuitive trend data for MetaTrader users.
The Evolution of Zero-Lag Momentum Trading
To understand why the Color Zero Lag Trix Osma is highly effective, it helps to break down its underlying components:
- The TRIX Oscillator: A classic momentum indicator based on a triple-exponentially smoothed moving average. It filters out minor market noise to highlight long-term cycles.
- The OSMA (Oscillator of Moving Averages): Commonly used to show the difference between an indicator line and its signal line, highlighting shifts in momentum before they reflect in the price.
Standard TRIX and Osma configurations inherently lag behind real-time Price Action because they rely on historical averages. The Color Zero Lag Trix Osma incorporates a proprietary zero-lag mathematical formula. It compensates for the delay caused by moving averages, allowing the indicator to react instantaneously to sudden shifts in buying or selling pressure.
Visualizing Market Trends and Reversals
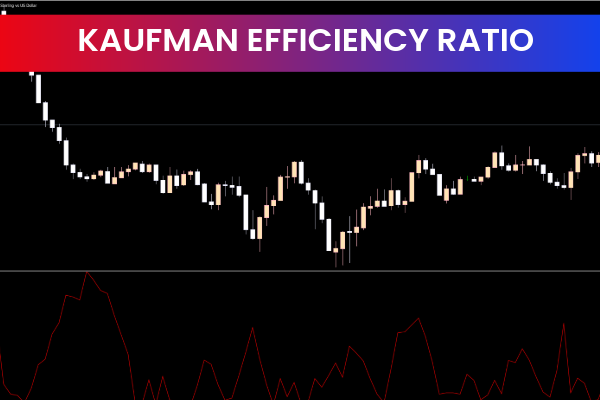
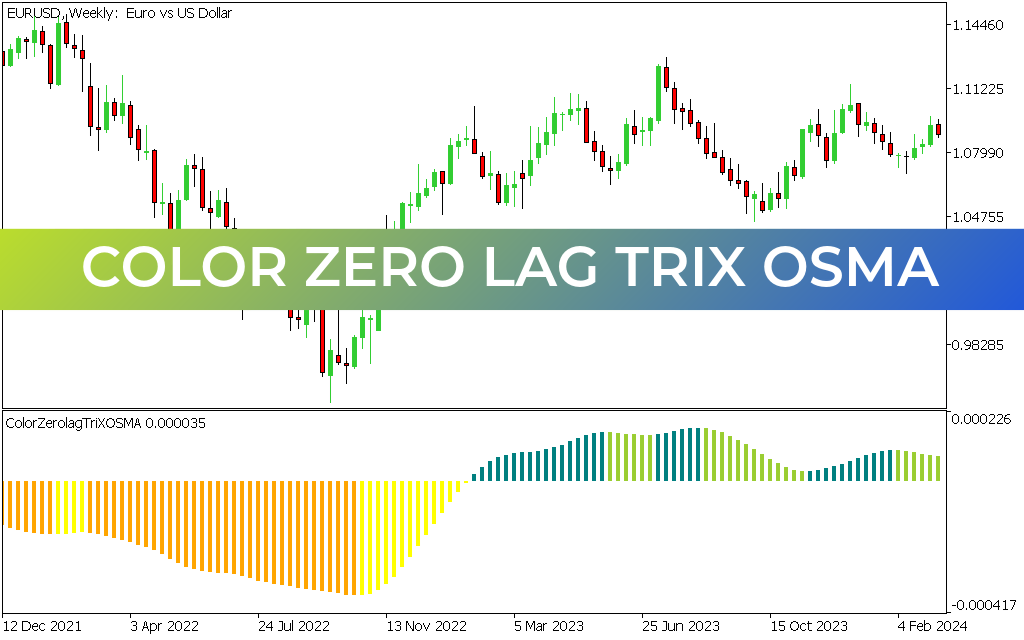
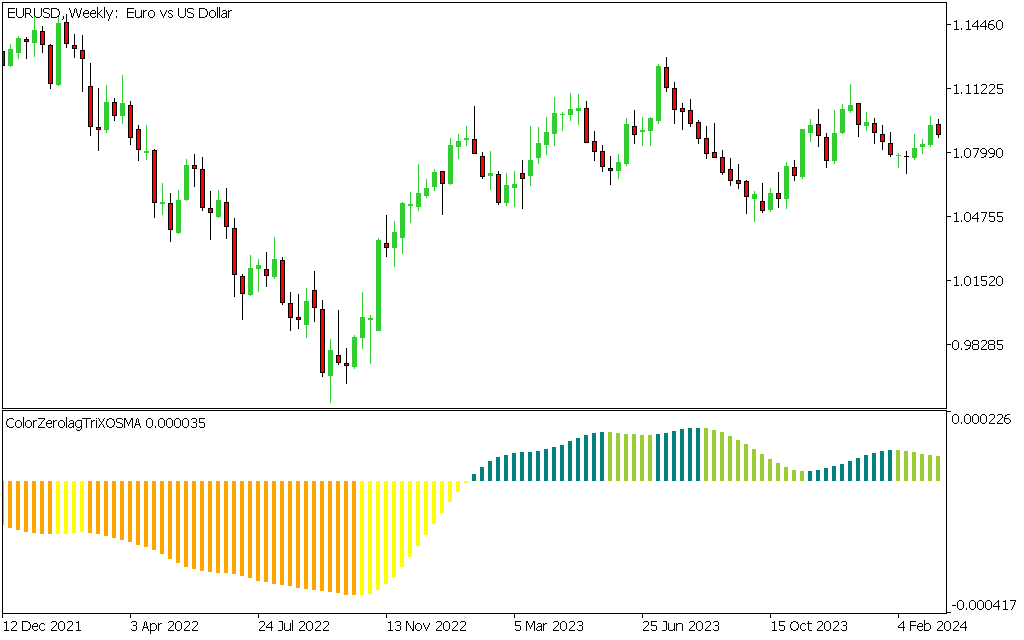
As displayed on the EURUSD weekly chart, the indicator replaces cluttered trendlines with a clean, color-coded histogram located in a sub-window below the price action. This visual format simplifies trend identification:
- Warm Tones (Orange and Yellow): Indicate dominant bearish momentum. The depth and color transitions reflect the acceleration or deceleration of a markdown phase.
- Cool Tones (Blue, Teal, and Green): Signal a shift to bullish momentum. The rising histogram bars confirm a healthy, active uptrend.
The most powerful aspect of this indicator is its performance during major market pivots. For example, during the extended EURUSD downtrend throughout 2022, the histogram consistently printed steady orange bars. As the trend exhausted and prepared for a massive bullish reversal late in the year, the bars transitioned to yellow, signaling diminishing selling pressure before rapidly crossing the zero-line into teal and green.
Optimizing Strategies Across Multiple Timeframes
While the attached weekly chart highlights its effectiveness for long-term swing trading and position trading, the Color Zero Lag Trix Osma is highly adaptive. Day traders and scalpers can utilize it on lower timeframes (such as M5 or M15) to spot immediate momentum shifts without being misled by minor price spikes.
By filtering out market noise while eliminating traditional indicator delay, this tool offers a reliable foundation for building mechanical trading rules—whether you trade breakouts, trend continuations, or mean reversions.
1 Download
Last Update:
May 24, 2026 01:52 AM
Published:
Jan 15, 2026 20:31 PM
Category: