Master Trend Strength and Direction with the Wilders DMI Average Indicator
In technical analysis, identifying whether a market is actively trending or simply consolidating sideways is a foundational challenge. Standard indicators like simple moving averages often fail during choppy, non-directional market phases, resulting in multiple false breakouts and costly whipsaws. Developed by legendary technician J. Welles Wilder, the Directional Movement Index (DMI) framework offers an elegant solution. The Wilders DMI Average indicator refines this classic formula, smoothing out high-frequency noise to give retail day traders an exceptionally clear view of market strength and direction.
Here is an in-depth operational breakdown of how this classic indicator works and how to implement it into a rules-based trading strategy.
Understanding the Mechanics of Wilders DMI Average
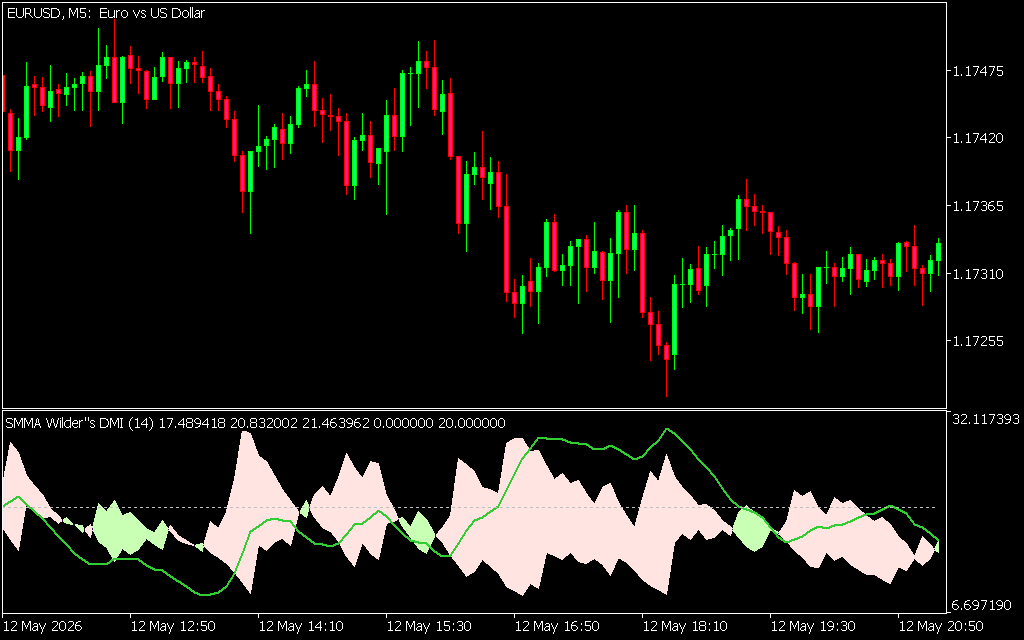
The Wilders DMI Average indicator operates within a dedicated sub-window below your primary candlestick chart. Unlike standard momentum oscillators that track price relative to a fixed historical boundary, this system evaluates the relationship between price highs and lows to measure directional buying and selling pressure.
The technical dashboard consists of three highly interactive lines working in perfect mathematical alignment:
- The Blue Line (+DI): The Positive Directional Indicator, which isolates real-time upward movement and measures the current strength of market buyers.
- The Red Line (-DI): The Negative Directional Indicator, which isolates downward price extensions and measures the strength of market sellers.
- The Yellow Line (ADX): The Average Directional Index, calculated using Welles Wilder’s custom smoothing technique. This baseline measures the absolute strength of the macro trend, regardless of whether price is moving up or down.
As demonstrated on the EURUSD M5 chart, the indicator maps out structural trend shifts flawlessly. When +DI and -DI cross, it flags an immediate change in market dominance, while the rising ADX line confirms when a minor breakout is turning into a major trend expansion.
Core Strategic Benefits for Modern Day Traders
- Objective Trend Strength Assessment: The yellow ADX line acts as a strict volatility filter. A value rising above 20 or 25 indicates a strong trend, while an ADX below 20 warns traders to avoid trend-following entries.
- Clean Visual Crossovers: The interaction between the blue and red directional lines removes human bias, giving scalpers an objective visual trigger for entering or exiting trades.
- Advanced Whipsaw Protection: By utilizing Welles Wilder’s specific exponential smoothing logic, the indicator reduces sudden, erratic spikes during quiet sideways sessions.
Practical Trading Rules and Application
To secure a strong technical edge with the Wilders DMI Average indicator on platforms like MetaTrader, apply these two core trading rules:
- The Trend-Strength Crossover Entry: Watch for a fresh crossover where the blue line (+DI) moves cleanly above the red line (-DI). Before executing a buy order, check the yellow ADX line to confirm it is curving upward and climbing above 20. This confluence ensures you are entering a fresh trend right as institutional volume is expanding. Place your stop-loss just below the local swing low.
- The Volatility Exhaustion Exit: When riding an active trend, watch the yellow ADX line closely as it reaches extreme upper levels (such as above 40 or 50). If the ADX peaks and begins to hook downward, it signals that the underlying market cycle is losing steam—giving you a premium warning to lock in profits before a sharp reversal occurs.
1 Download
Last Update:
May 19, 2026 02:25 AM
Published:
Jan 19, 2026 20:18 PM
Category: