Unlock High-Probability Reversals with the RSI Divergences Indicator
In the world of technical analysis, the Relative Strength Index (RSI) is a legendary tool. However, most retail traders use it simply to spot "overbought" or "oversold" conditions—a strategy that often fails during strong, trending markets. To gain a true professional edge, you must look deeper into the relationship between Price Action and momentum. The RSI Divergences indicator is a sophisticated technical study designed to identify the exact moments when price and momentum lose synchronization, signaling an imminent and powerful market reversal.
Understanding the Power of Divergence
Divergence occurs when the price of an asset moves in the opposite direction of a technical indicator. It is one of the most reliable leading signals in Forex trading because it reveals that the current trend is losing "fuel," even if the price is still making new highs or lows.
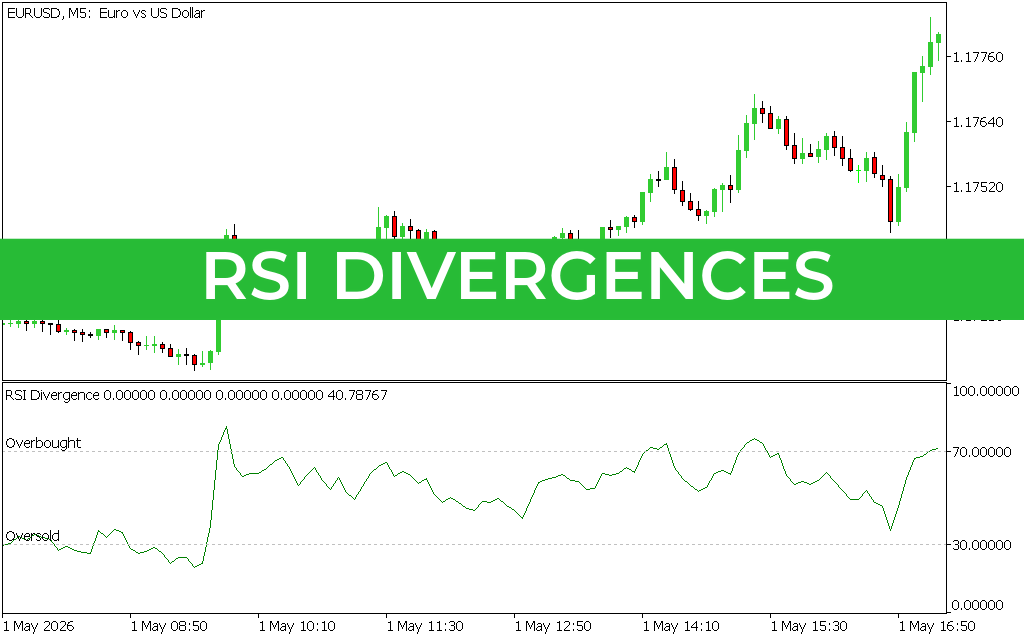
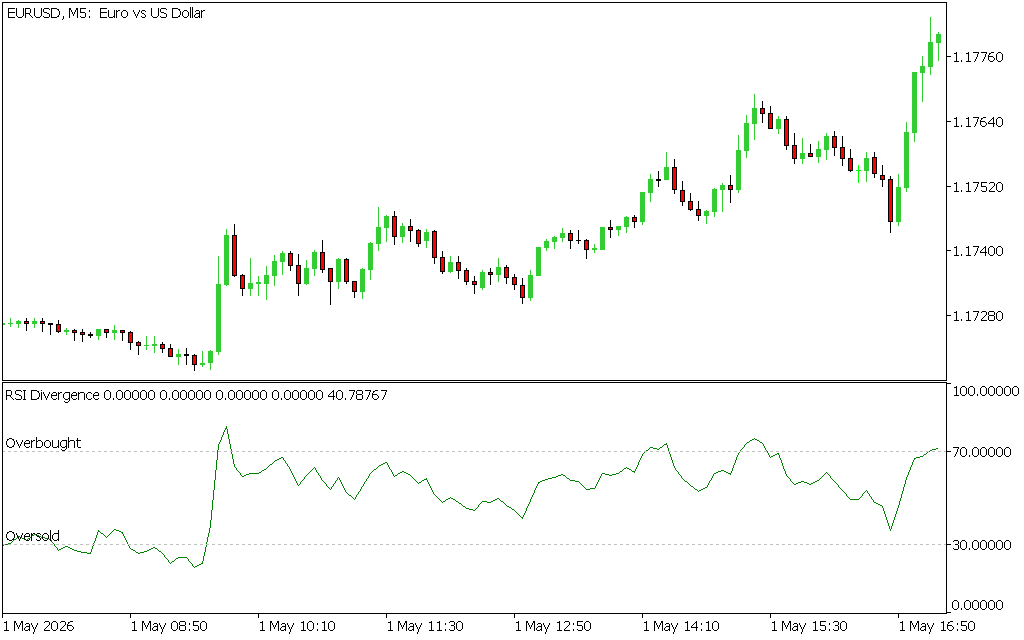
As illustrated in the provided EUR/USD M5 chart, the RSI Divergences indicator automates the detection of two primary types of signals:
- Regular Bullish Divergence: Price makes a "Lower Low," but the RSI makes a "Higher Low." This indicates that selling pressure is exhausting, and a bullish bounce is likely.
- Regular Bearish Divergence: Price makes a "Higher High," but the RSI makes a "Lower High." This warns that buying momentum is fading, and a bearish correction is on the horizon.
Why Use an Automated RSI Divergence Tool?
Spotting divergences manually is an art form that requires years of experience and a keen eye for detail. The RSI Divergences indicator for MT4 and MT5 removes the subjective guesswork by:
- Real-Time Scanning: The indicator constantly monitors every candle close to identify structural discrepancies between price and the oscillator.
- Visual Alerts: It draws clear trendlines directly on both the price chart and the RSI sub-window, ensuring you never miss a high-probability setup.
- Filtering Market Noise: By utilizing advanced smoothing algorithms, the indicator distinguishes between minor price fluctuations and genuine momentum shifts.
Strategic Implementation: Scalping and Day Trading
In the attached M5 chart, notice how the RSI (14) serves as the engine for this analysis. For scalpers, RSI divergence on a 5-minute timeframe offers a "window into the future." When you see a bearish divergence forming at a major resistance level, it provides a high-confluence reason to enter a short position with a tight stop-loss.
To maximize your win rate, combine the RSI Divergences indicator with price action confirmation, such as a pin bar or an engulfing candlestick pattern. When the mathematical signal of divergence aligns with a visual price action trigger, you have one of the most potent setups in technical trading.
Conclusion
The RSI Divergences indicator is an essential upgrade for any trader serious about timing their entries with surgical precision. It transforms a standard oscillator into a proactive trend-reversal machine. Stop trading based on lagging indicators and start anticipating the market’s next move with the power of automated divergence detection.
1 Download
Last Update:
May 03, 2026 01:35 AM
Published:
Jan 28, 2026 21:52 PM
Category: