Maximize Precision with the Nice Value Charts Indicator
In highly volatile financial markets, relying purely on traditional price charts can cloud a trader’s judgment. Standard candlestick charts show price relative to time, but they fail to show whether an asset is objectively cheap or expensive independent of its recent trend. For fast-paced day trading and Scalping on major currency pairs like the EUR/USD, finding a clear anchor for valuation is critical. The Nice Value Charts indicator is designed to solve this exact problem by re-quantifying Price Action into a pure valuation model.
What is the Nice Value Charts Indicator?
The Nice Value Charts indicator is an advanced technical analysis tool that isolates the true value of an asset from its underlying directional trend. Created to help traders identify short-term overvalued and undervalued market states, this sub-window indicator strips away the trend bias and displays price action as a standardized oscillator.
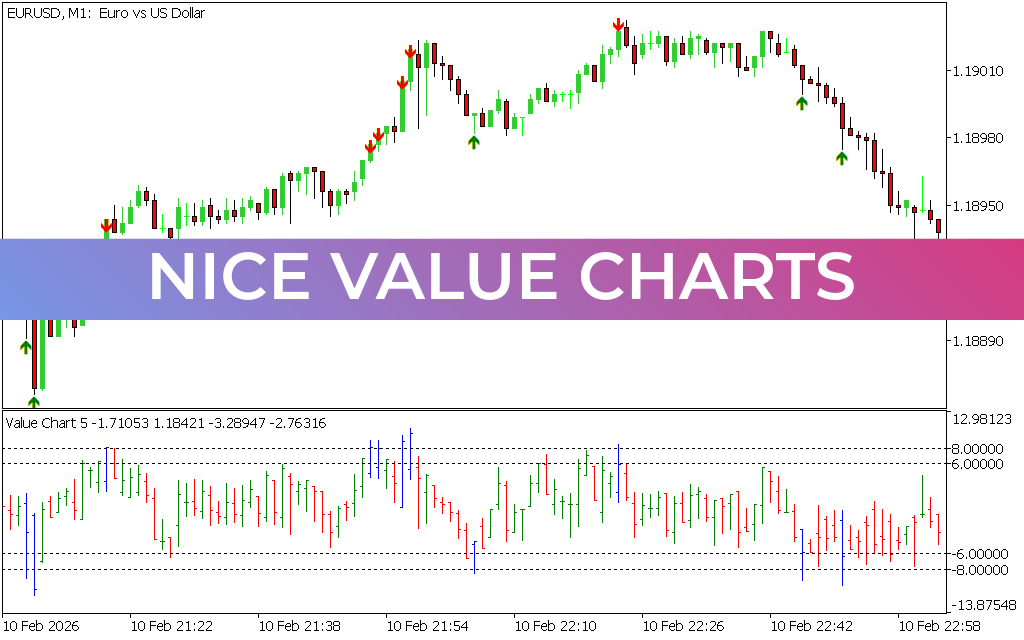
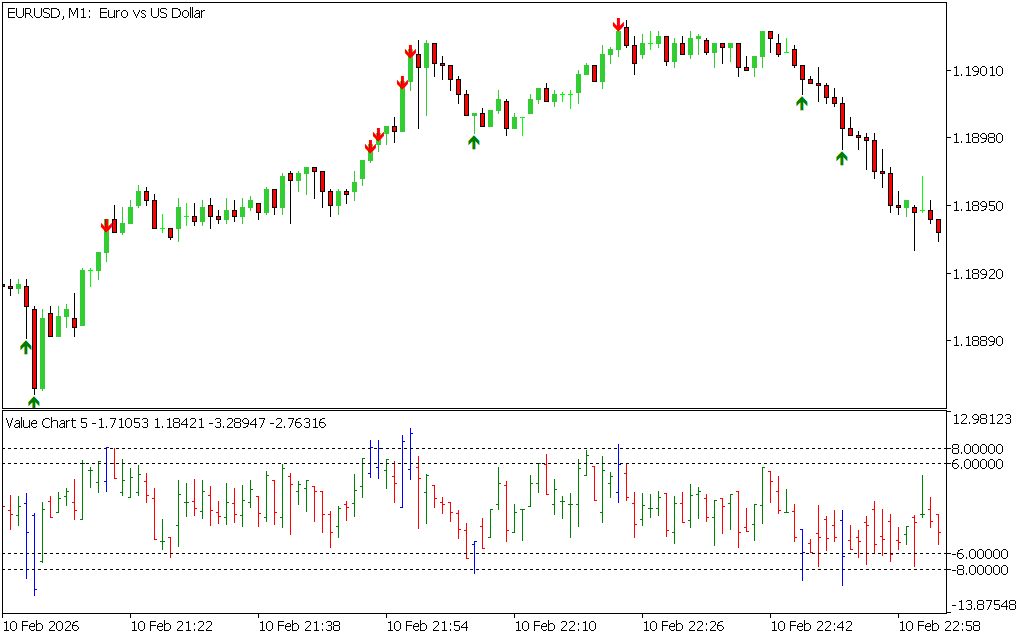
Instead of looking at raw price data, the indicator utilizes a specialized mathematical algorithm that measures price ranges relative to historical volatility. It then plots these values using color-coded candlesticks or bars within a bounded grid, typically featuring critical valuation thresholds at +6.00, +8.00, -6.00, and -8.00.
Key Features and Trading Insights
- Objective Valuation Tiers: The indicator clarifies market conditions at a glance. Levels above +6.00 represent overvalued zones, while levels below -6.00 signal undervalued zones. Extreme spikes past +/-8.00 warn of highly unsustainable price exhaustion.
- On-Chart Signal Arrows: To eliminate analytical hesitation, the indicator plots green buy arrows and red sell arrows directly onto your main trading chart. These triggers sync perfectly with extreme valuation peaks in the sub-window.
- Color-Coded Momentum Bars: The indicator window uses distinct color variations (such as green, red, and blue) to indicate the changing strength of individual candle ranges. This allows you to visually track momentum expansion on fast intervals like the 1-minute (M1) chart.
- Divergence Detection: It serves as an excellent tool for spotting hidden divergences. If raw price action prints a higher high but the Nice Value Chart fails to break its previous peak, a correction is imminent.
How to Trade with Nice Value Charts
Trading with the Nice Value Charts indicator involves capitalizing on rapid mean-reversion setups when price pushes outside its normal boundaries.
- Short Entry Setup: When the asset surges and the indicator bars pierce the upper +6.00 or +8.00 horizontal lines, the market is overbought. Wait for a red down-arrow to print on the main chart as confirmation that the price is rolling over, then execute a short trade.
- Long Entry Setup: Conversely, during an aggressive sell-off, look for the indicator bars to drop below the lower -6.00 or -8.00 thresholds. Once a green up-arrow appears on the main chart, it confirms that the asset is severely undervalued and a bullish bounce is underway.
Incorporate the Nice Value Charts indicator into your trading system today to replace speculation with clear, objective market valuation.
2 Downloads
Last Update:
May 19, 2026 16:15 PM
Published:
Jan 19, 2026 19:38 PM
Category: