Uncovering True Market Direction: The Linear Regression Slopes Indicator
In the world of technical analysis, traders constantly seek tools that can reliably identify trend direction and strength while filtering out short-term market noise. While standard moving averages are widely used for this purpose, they are mathematically burdened by lag, often alerting traders to a trend change only after a significant portion of the price move has already materialized. To capture statistical direction with minimal delay, advanced market technicians turn to quantitative methods. The Linear Regression Slopes Indicator leverages mathematical regression models to calculate real-time trend velocity directly on your trading workspace.
Here is an analytical look at how this mathematical indicator processes data and how to use its signals to identify institutional trends.
The Mathematical Engine of Linear Regression Slopes
Linear regression is a quantitative statistical tool used to find the "best-fit" line through a specific series of data points. When applied to financial trading terminals, the algorithm evaluates closing prices over a designated lookback period, fitting a straight mathematical line through the candlestick arrangement to minimize the total distance between the line and each individual price point.
The slope of this best-fit line represents the rate of price change per unit of time.
- Positive Slope Values: The line tilts upward, proving that buying volume is efficiently driving an active accumulation phase.
- Negative Slope Values: The line angles downward, confirming that systemic selling pressure is driving an institutional markdown phase.
By charting the mathematical slope as an independent oscillator curve rather than a lagging overlay line, this system exposes subtle changes in trend velocity before they become obvious on the main chart.
Reading the Sub-Window Oscillator and Value Thresholds
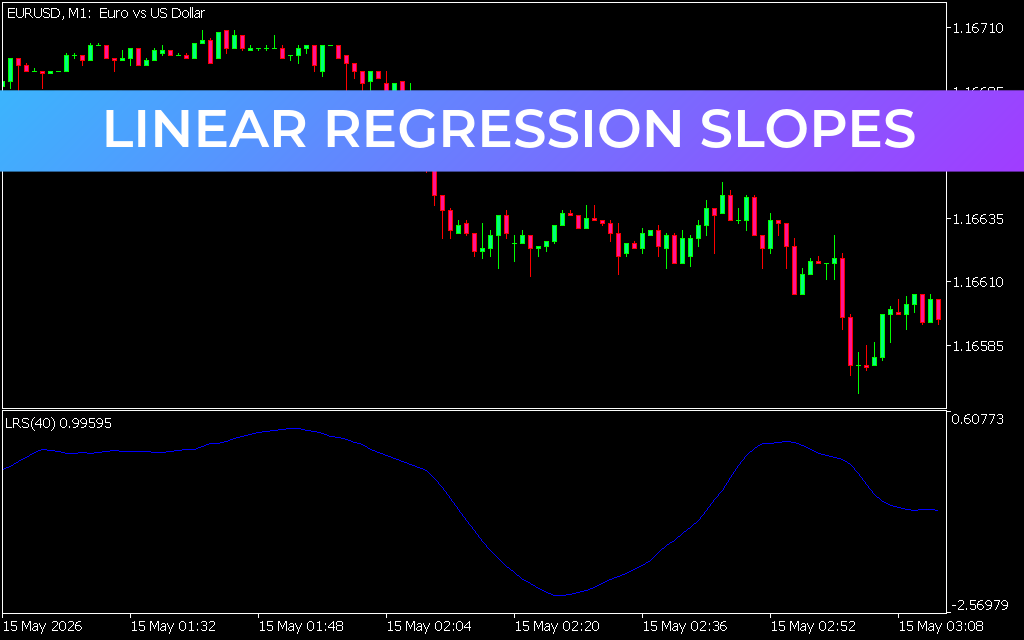
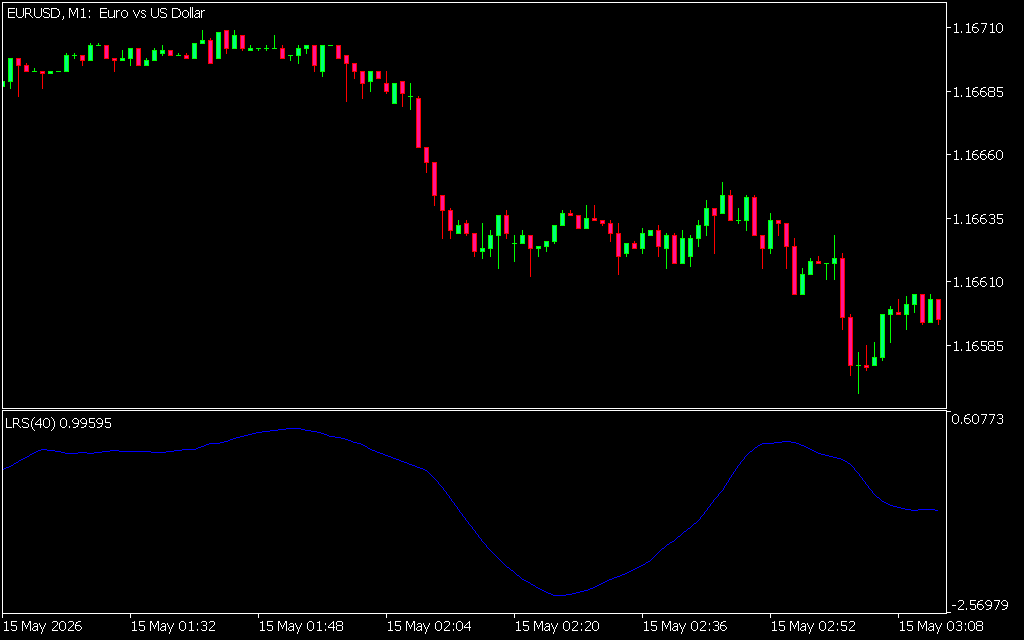
As demonstrated on the EUR/USD chart setup, the indicator operates cleanly within a dedicated sub-window beneath the main price candles, replacing complex formulas with a highly responsive, color-coded line matrix:
- The Zero-Line Center Boundary ($0.00$): The horizontal center axis acts as the master equilibrium checkpoint. When the slope line is trapped near zero, it reveals a flat, range-bound Market Structure where trend-following models should be paused.
- The Bullish Velocity Line (Thick Light Blue Line): When a market breaks into a validated uptrend, the slope curve crosses above the zero threshold and turns a distinctive light blue. The higher the curve climbs, the steeper and more powerful the underlying upward trend.
- The Bearish Liquidation Line (Thick Orange Line): Conversely, during an active market decline, the slope drops below zero and shifts to a solid orange color. This visual change alerts short-sellers that bearish momentum has firmly seized control of the asset's structural direction.
Operational Guidelines for Active Trading Terminals
To extract a consistent technical edge from the Linear Regression Slopes toolkit on your execution terminal, implement these structured guidelines:
- Precision Zero-Line Crossings: Look for moments where the slope curve shifts from orange to light blue as it breaks above the $0.00$ axis. This crossover confirms that Price Action has successfully completed a structural base and is entering a fresh, statistically backed expansion phase.
- Identifying Momentum Divergence: If price action prints a fresh higher high in the main window, but the light blue slope line prints a lower peak, it exposes a loss of institutional buying speed. This divergence serves as an early warning to tighten trailing stop-loss orders.
- Filtering False Breakouts: During low-volume consolidation channels, the slope curve will repeatedly cross the zero line in flat, narrow movements. Stand aside during these periods and wait for a bold, elongated curve extension to confirm true institutional capital flow.
1 Download
Last Update:
May 17, 2026 02:49 AM
Published:
Jan 20, 2026 22:01 PM
Category: