Spot Key Market Reversals: The Ultimate DeMarker Indicator for MT5
Timing market turns with pinpoint precision is one of the most profitable skills a Forex trader can develop. While many oscillators struggle with lagging data or endless false signals, the DeMarker (DeM) Indicator for MT5 offers an elegant, mathematically sound approach to catching shifts in market demand. Created by legendary technical analyst Tom DeMark, this oscillator helps traders cut through market noise to locate exact overbought and oversold conditions.
What is the DeMarker Indicator?
The DeMarker indicator is a momentum oscillator that evaluates the current period's highs and lows against the previous period's dimensions to measure the underlying demand for an asset. Rather than merely tracking price changes, it focuses on buying enthusiasm.
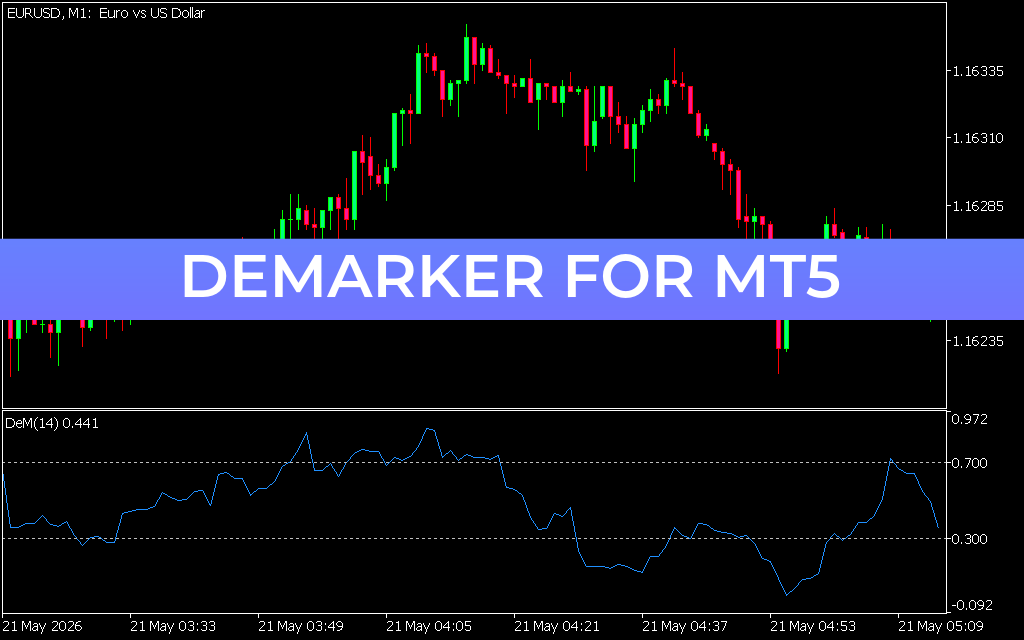
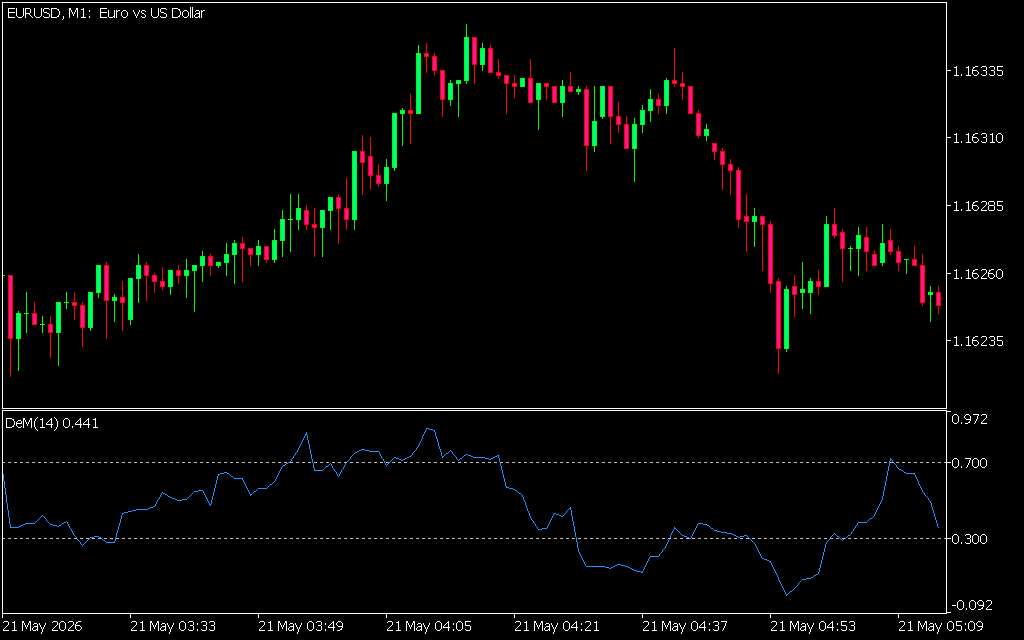
As shown in the EURUSD 1-minute chart, the DeM indicator runs in an independent sub-window below the main Price Action, fluctuating between numerical values of 0.0 and 1.0 (or mapped dynamically, as shown here with extreme zones):
- Overbought Zone (Above 0.700): When the blue DeM line surges past the 0.700 threshold, it signals overextended buying pressure, warning traders that a bearish reversal or correction is on the horizon.
- Oversold Zone (Below 0.300): When the line drops under 0.300, it highlights an overextended sell-off, signaling an exhaustion of sellers and a high-probability buying opportunity.
Why Choose the DeMarker Indicator for MetaTrader 5?
- Leading Overbought/Oversold Logic: By emphasizing intra-period price maxima and minima over basic closing prices, the DeMarker tool frequently spots exhaustion before classic oscillators like the RSI.
- Reliable Divergence Tracking: One of its most potent uses is spotting hidden divergences. If the price makes a new high but the DeM line creates a lower high, a trend collapse is often imminent.
- Clean, Uncluttered Interface: The indicator isolates itself cleanly in a lower panel, leaving your primary candlestick charts clear for Candlestick Patterns, price action structural lines, or moving averages.
- Perfect Multi-Timeframe Filter: It functions seamlessly across any timeframe. Scalpers can rely on it to time tight M1 setups, while swing traders can deploy it on Daily charts to catch macro swing failures.
Trading Strategies with DeMarker
To exploit this tool on Indicator Forest, look for structural shifts. A textbook buy entry occurs when the DeM line falls deep into the oversold region (below 0.300) and then successfully crosses back above the 0.300 boundary line.
For the highest win rates, pair DeMarker with a volume filter or trend-defining moving average. If the macro trend is strongly bullish, ignore overbought sell signals entirely and exclusively use oversold dips under 0.300 to time optimized pullbacks in a rising market.
13 Downloads
Last Update:
May 21, 2026 16:15 PM
Published:
Jan 18, 2026 13:14 PM
Category: