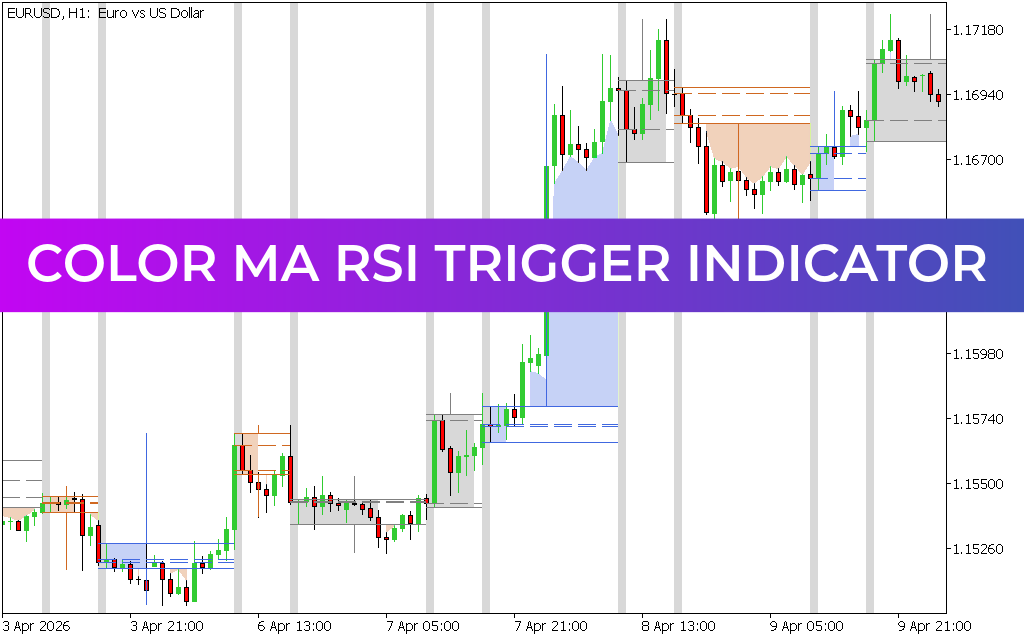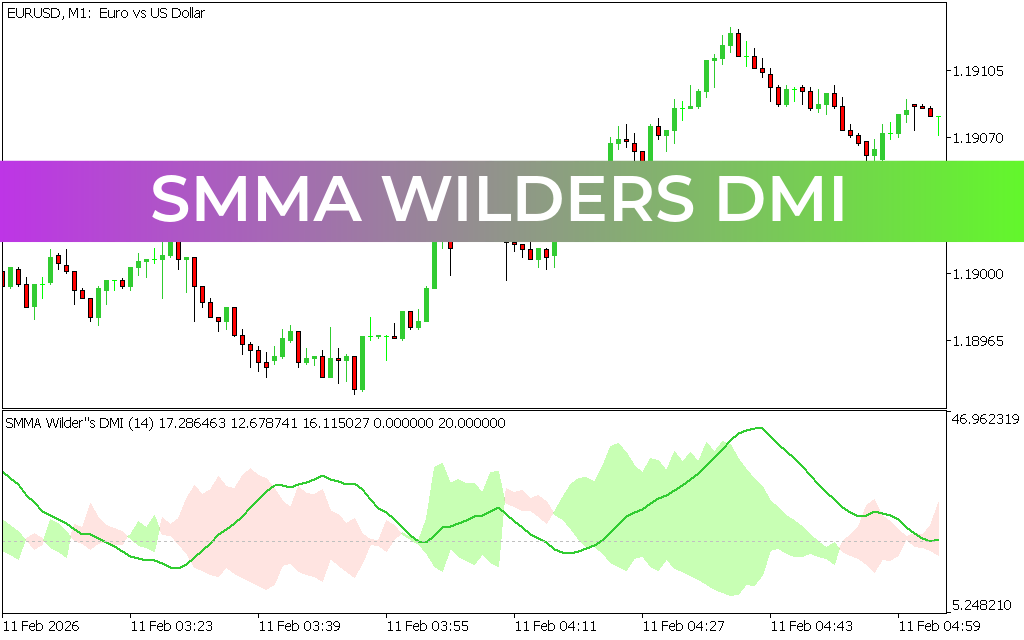
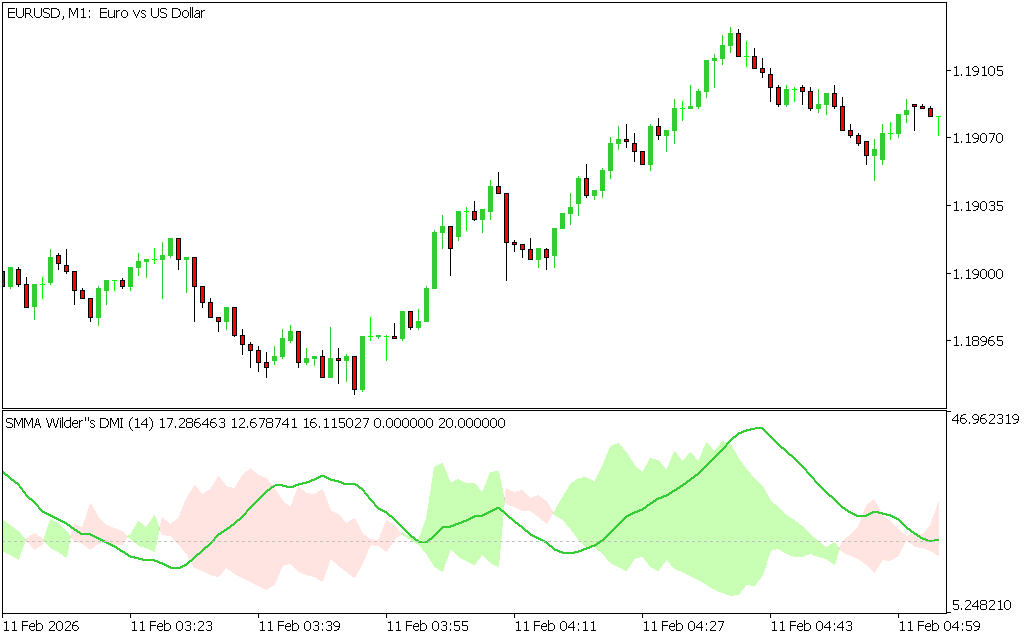
Master Trend Direction and Strength with the SMMA Wilder's DMI Indicator
Trading in the direction of the dominant market trend is one of the most reliable ways to build a sustainable edge. However, many trend-following indicators suffer from two major flaws: they either lag too far behind volatile price expansions, or they generate highly erratic whipsaws during sideways consolidation. For day traders and scalpers monitoring liquid currency pairs like the EUR/USD, understanding both the direction and the intensity of a move is critical. The SMMA Wilder's DMI indicator offers a sophisticated, mathematically smooth solution to filter market noise and isolate true institutional trends.
What is the SMMA Wilder's DMI Indicator?
The SMMA Wilder's DMI is an advanced modification of J. Welles Wilder’s classic Directional Movement Index (DMI). While the traditional DMI uses standard moving averages to calculate directional lines, this upgraded version replaces them with a Smoothed Moving Average (SMMA) algorithm.
The core system consists of two primary components: the Positive Directional Indicator ($+\text{DI}$) and the Negative Directional Indicator ($-\text{DI}$). The $+\text{DI}$ measures how aggressively buyers are pushing the market high over a designated lookback window (typically 14 periods), while the $-\text{DI}$ tracks the relative strength of the sellers pushing lows. By smoothing these data sets with an SMMA filter, the indicator filters out intraday micro-fluctuations, giving traders a much cleaner view of macro trend acceleration.
Key Visual Features and Trading Insights
- Dynamic Cloud Geometry: To maximize visual efficiency, the indicator fills the space between the directional lines with a clear visual cloud overlay. A bright green cloud represents a strong bullish environment, while a muted pink/red cloud signals dominant bearish pressure.
- Lag-Reduced Signal Line: The main green oscillator line actively tracks the net divergence between buyers and sellers. As shown on ultra-fast 1-minute (M1) charts, the line acts as a highly sensitive trigger point for catching sharp trend reversals early.
- The Volatility Threshold: The system features a horizontal baseline (typically set at the 20.00 level). When the main line climbs above this boundary, it indicates that the asset is out of consolidation and entering a powerful, highly tradeable trend expansion.
- Workspace Optimization: Operating in its own dedicated sub-window below your core chart ensures that your main workspace remains pristine for plotting Candlestick Patterns, manual trendlines, or structural support levels.
How to Trade with SMMA Wilder's DMI
Trading with this tool involves capitalizing on crossovers, cloud expansions, and structural trend line validations.
- Bullish Entry Setup: Watch the sub-window until a green cloud forms and the main green tracking line crosses decisively above the 20.00 horizontal volatility threshold. This confirms that a true bullish trend has started. Enter a buy position and ride the upward expansion until the line rolls over.
- Bearish Entry Setup: Conversely, when a pink cloud develops and the main tracking line spikes upward while the $-\text{DI}$ line dominates the panel, selling velocity is maximizing. Execute a short position with a protective stop-loss placed right above the recent local swing high.
Transform your approach to trend tracking by downloading the SMMA Wilder's DMI indicator today to eliminate false signals and capture market momentum with precision.
Last Update:
May 19, 2026 16:40 PM
Published:
Jan 19, 2026 14:08 PM
Category: