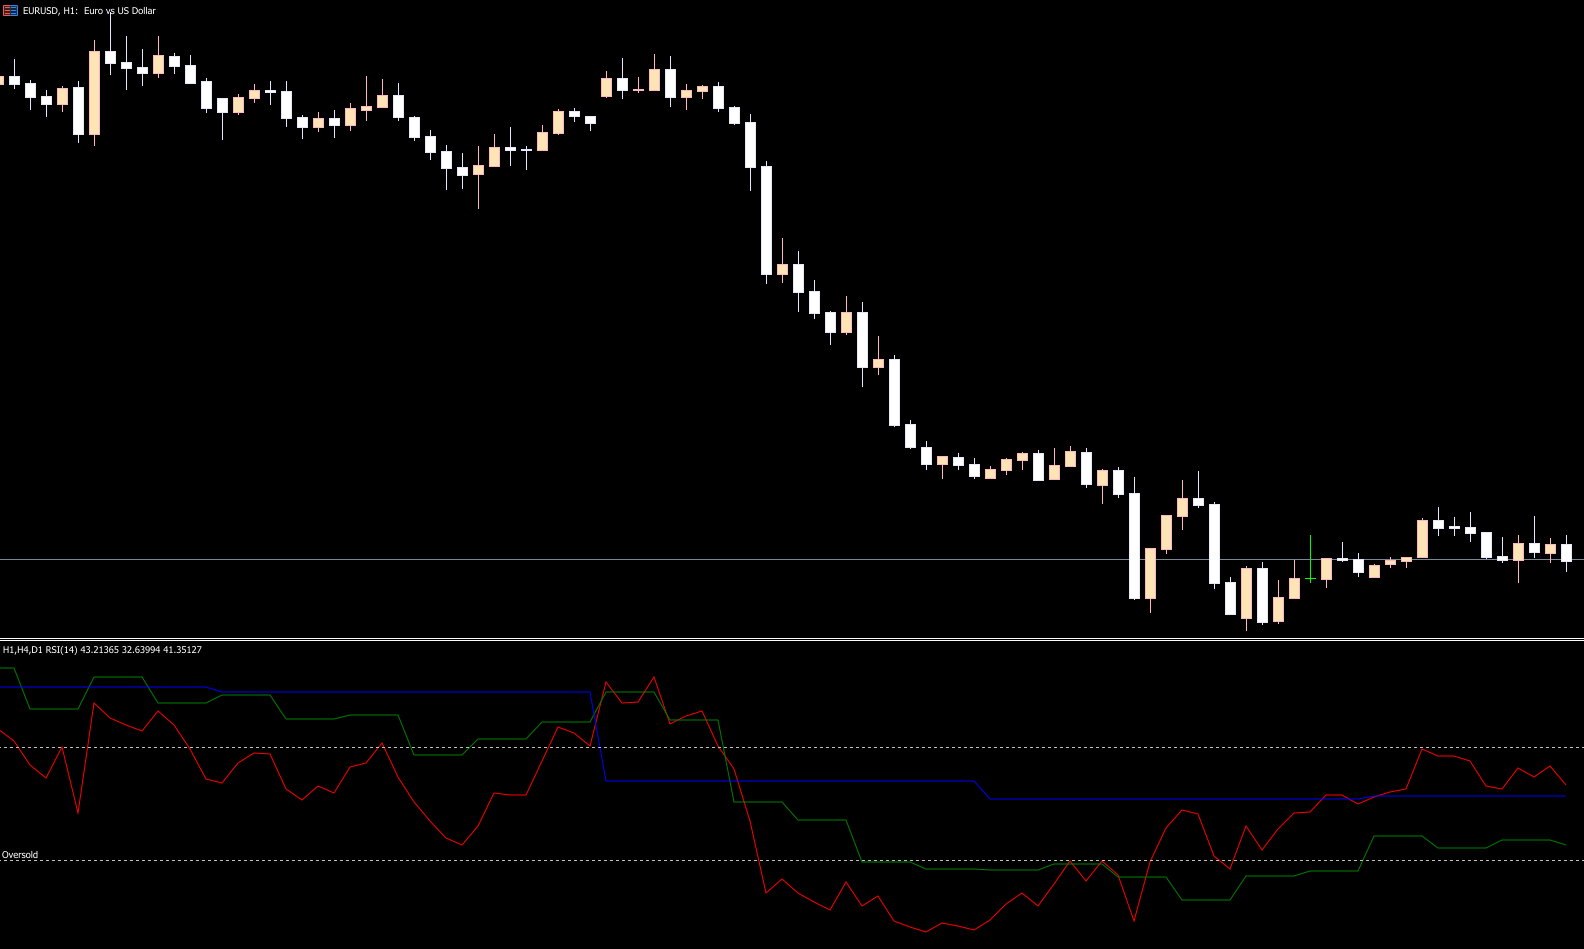
The RSI Mtf Indicator for MT5 is an advanced version of the classic Relative Strength Index (RSI). Unlike the standard RSI, this indicator allows traders to view RSI values from multiple timeframes simultaneously on a single chart, providing a broader perspective of market momentum.
This tool is especially helpful for traders who want to avoid focusing solely on a single timeframe, which can lead to misleading conclusions. By monitoring multiple timeframes, traders can identify potential overbought or oversold conditions more accurately.
How the RSI MTF Indicator Works
The RSI MTF Indicator overlays RSI values from selected timeframes on the MT5 chart. For example:
A trader may see an oversold condition on the M30 chart.
At the same time, the H1 chart may indicate overbought conditions.
This multi-timeframe view prevents traders from entering trades based on a narrow perspective and allows them to assess the overall market trend more effectively.
Practical Trading Tips
Identify Overbought Conditions: Look for RSI readings above 70 across multiple timeframes to confirm strong momentum.
Identify Oversold Conditions: RSI readings below 30 on multiple timeframes suggest potential reversals.
Align Trades with Broader Trends: Use higher-timeframe RSI readings to confirm the direction of your trades on lower timeframes.
Combine with Other Indicators: For better accuracy, integrate RSI MTF signals with Price Action, trend indicators, or support/resistance levels.
Benefits of the RSI MTF Indicator
Simultaneously monitors RSI on multiple timeframes
Reduces false signals from single-timeframe analysis
Helps identify overbought and oversold conditions more reliably
Supports better trade entries, exits, and risk management
Works across forex, stock, and cryptocurrency markets
Conclusion
The RSI MTF Indicator for MT5 enhances traditional RSI analysis by providing a multi-timeframe perspective. It allows traders to make more informed decisions, reduce risk, and align trades with the broader market trend. This makes it an essential tool for both novice and experienced traders seeking comprehensive momentum analysis.
Download the RSI MTF Indicator today at IndicatorForest.com and gain a clearer view of market momentum across all timeframes.
FAQ
5 Downloads
Published:
Nov 13, 2025 03:19 AM
Category: