Elevate Your Trading Precision with the Color Metro Stochastics Indicator
In the competitive world of Forex and stock trading, timing is everything. While traditional oscillators provide a baseline for market momentum, they often lack the visual clarity needed for rapid decision-making. The Color Metro Stochastics Indicator is a modern solution designed to simplify complex market data, offering traders a highly intuitive way to identify overbought and oversold conditions with surgical precision.
What is the Color Metro Stochastics Indicator?
The Color Metro Stochastics is an enhanced version of the classic Stochastic Oscillator. While it retains the core mathematical logic of tracking momentum—comparing a security's closing price to its price range over a specific period—it introduces a dynamic color-coding system.
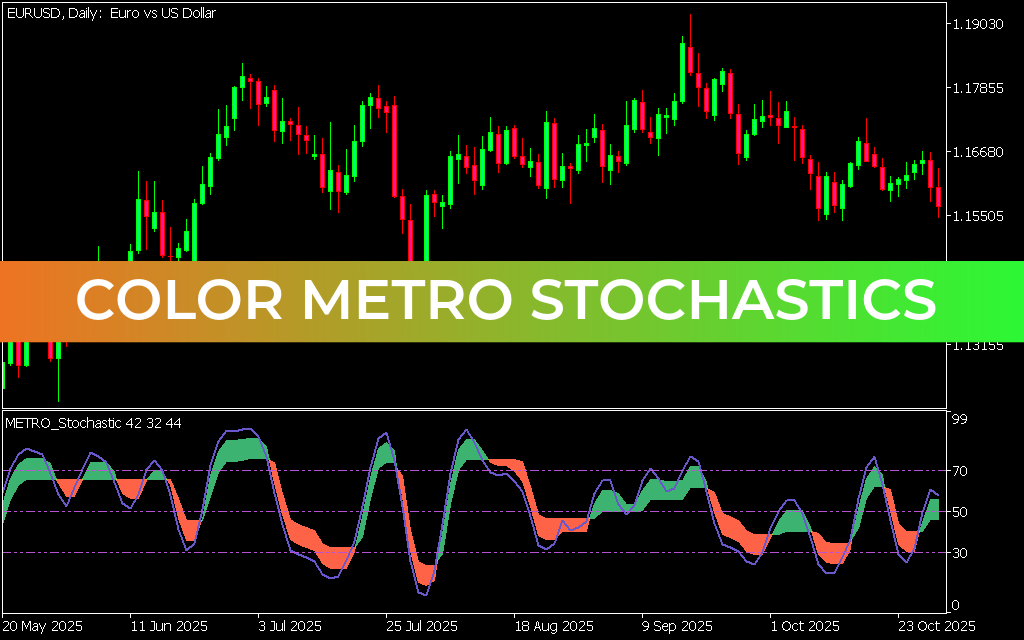
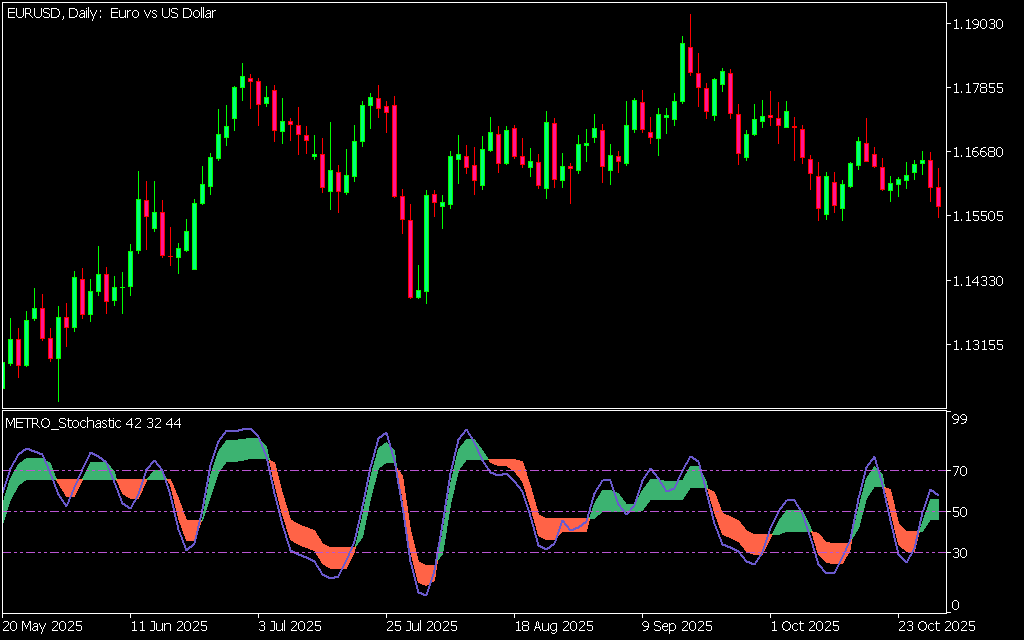
As seen in the provided file EURUSD, Daily: Euro vs US Dollar, the indicator transforms the standard oscillator lines into a color-filled "Metro" style band. This visual enhancement allows traders to immediately distinguish between bullish momentum (green) and bearish pressure (red) without having to squint at thin, overlapping lines.
Key Features and Benefits
- Intuitive Trend Identification: The color-filled zones act as a heat map for momentum. When the area turns green, it indicates that the bulls are in control; when it turns red, the bears have taken the lead.
- Clear Overbought/Oversold Levels: With fixed levels at 30 and 70 (or 20 and 80 depending on your settings), the Color Metro Stochastics highlights potential reversal points. The color shifts near these extremes provide a powerful visual "heads-up" for upcoming price exhaustion.
- Reduced Mental Fatigue: Professional trading requires scanning multiple pairs and timeframes. The "at-a-glance" nature of this indicator reduces the cognitive load, allowing you to focus on executing your strategy rather than deciphering messy charts.
- Versatility: This tool is effective across all asset classes, including Forex, Commodities, and Indices, and performs exceptionally well on higher timeframes like the Daily chart.
How to Trade with Color Metro Stochastics
The most effective way to utilize this tool is by looking for color-confirmed reversals. For instance, in the EURUSD, Daily: Euro vs US Dollar chart, a trader would look for the indicator to move below the 30 level and wait for the fill to turn green before considering a long position.
Furthermore, the indicator excels at identifying Divergence. If the price makes a new high but the Color Metro Stochastics makes a lower high (accompanied by a color shift), it serves as a strong warning of a looming Trend Reversal. This makes it an invaluable companion for both scalpers seeking quick momentum bursts and swing traders looking for major market turning points.
Conclusion
The Color Metro Stochastics Indicator takes a time-tested formula and upgrades it for the modern trading era. By combining mathematical accuracy with superior visual feedback, it empowers traders to stay on the right side of the trend. Whether you are a novice looking for clarity or a veteran streamlining your workflow, this indicator is a must-have addition to your trading arsenal.
1 Download
Last Update:
May 06, 2026 01:15 AM
Published:
Jan 27, 2026 13:27 PM
Category: