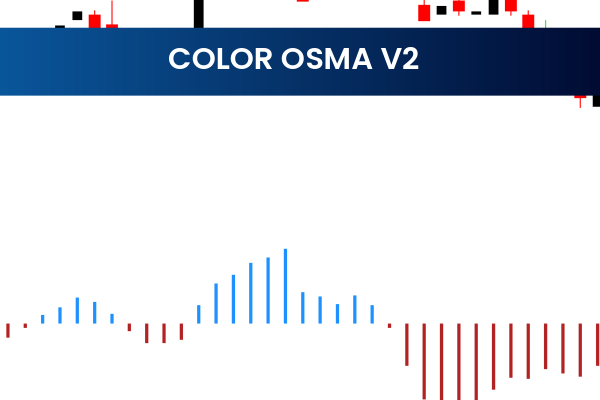
The Color OSMA Indicator is a popular and useful free Forex Indicator for the MetaTrader 4 (MT4) platform. Designed to provide a clear visual representation of market trends, it helps traders identify potential entry and exit points, making trading more precise and efficient.
Based on the oscillator of moving averages (OSMA), this indicator calculates the difference between two moving averages and uses this information to generate trading signals. By turning different colors depending on market conditions, the Color OSMA Indicator provides a simple yet powerful way to monitor trend strength and potential reversals.
What Is the Color OSMA Indicator?
The Color OSMA Indicator is built around two moving averages. The difference between these averages is visualized on the chart as a histogram that changes color depending on trend conditions:
Green Histogram: Indicates a bullish trend, suggesting potential buying opportunities.
Red Histogram: Indicates a bearish trend, suggesting potential selling opportunities.
This color-coding makes it easy for traders to quickly assess the market and decide on trades.
How the Color OSMA Indicator Works
The Color OSMA Indicator continuously calculates the difference between a fast-moving average and a slow-moving average. When the difference exceeds a defined threshold, the histogram changes color to reflect the trend:
Green signals a strong upward movement.
Red signals a strong downward movement.
Additionally, the indicator can help traders detect overbought and oversold conditions, which are useful for anticipating potential market reversals.
Key Features of the Color OSMA Indicator
The Color OSMA Indicator offers several valuable features:
Trend Direction Identification
Clearly shows whether the market is in a bullish or bearish trend.
Entry and Exit Points
Provides visual signals for potential buy or sell trades based on histogram color changes.
Overbought and Oversold Signals
Helps traders anticipate market reversals.
Simple Visual Interface
Easy-to-read histogram with color-coded trend signals.
Free and MT4 Compatible
Available for free and fully compatible with the MetaTrader 4 platform.
Benefits for Forex Traders
Using the Color OSMA Indicator can help traders:
Quickly identify the current market trend
Improve timing of trade entries and exits
Avoid trading against strong trends
Spot potential market reversals
Its simplicity and visual clarity make it an effective tool for traders of all levels.
How Traders Use the Color OSMA Indicator
Traders commonly use the Color OSMA Indicator to:
Enter trades when the histogram turns green for a bullish trend
Exit trades when the histogram turns red for a bearish trend
Confirm trades alongside other indicators like support/resistance or trend lines
Monitor overbought and oversold conditions to anticipate reversals
The indicator can be used across all timeframes and trading strategies, including Scalping, day trading, and swing trading.
Who Should Use the Color OSMA Indicator?
The Color OSMA Indicator is ideal for:
Beginner traders who need a simple visual trend tool
Intermediate traders looking to confirm trade setups
Experienced traders seeking a quick way to monitor momentum and Trend Strength
Its intuitive interface and easy-to-read signals make it a valuable addition to any MT4 trading setup.
Final Thoughts
The Color OSMA Indicator is a free and effective MT4 Forex tool that helps traders identify market trends, overbought/oversold conditions, and potential entry and exit points. By incorporating this indicator into your trading strategy, you can enhance your trading precision and make better-informed decisions.
Visit IndicatorForest.com to download the Color OSMA Indicator and explore more high-quality free MT4 Forex tools.
4 Downloads
Published:
Jan 08, 2026 14:25 PM
Category: