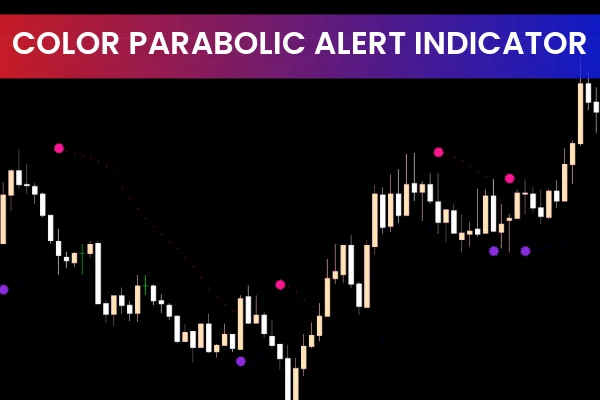
The Color Parabolic Alert Indicator for MT5 is an upgraded version of the classic Parabolic SAR, designed to give traders a more intuitive and visually appealing way to track market trends. By incorporating color-coded trend markers and customizable alerts, this tool helps traders identify trend reversals and momentum shifts with greater accuracy. It is especially useful for trend-following strategies, as it highlights potential entry and exit points with clarity.
Discover More
MetaTrader 5 • MT5 • MetaTrader 4 • Algo Trading • MT4 • Algorithmic Trading • Trading Strategy Guide • Virtual Private Servers (VPS) • Trading Platform Tutorial • Volume Profile Indicators
Color Parabolic Alert Indicator MT5: Trading Signals
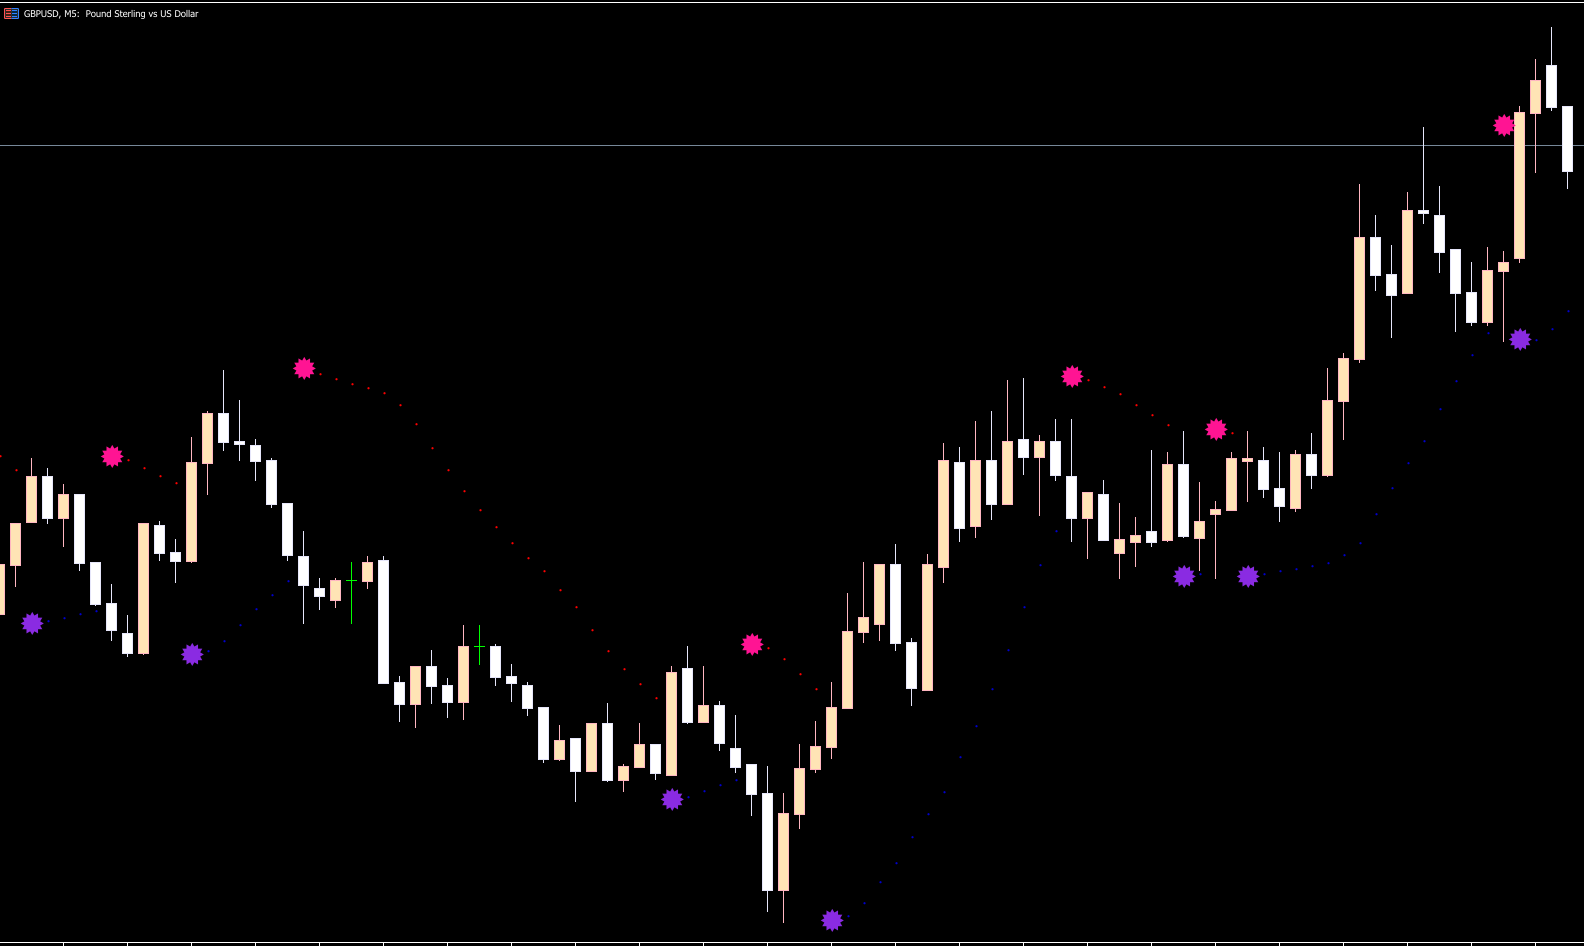
The Color Parabolic Alert Indicator MT5 generates signals based on market trend direction and potential reversals:
Blue dots below price → Indicates an uptrend, signaling possible buy opportunities.
Red dots above price → Indicates a downtrend, signaling possible sell opportunities.
The indicator also issues real-time alerts when a Trend Reversal occurs, allowing traders to react quickly. Additionally, major swing points are marked with larger colored dots, making potential market turning points easy to spot.
Conclusion
The Color Parabolic Alert Indicator MT5 is a powerful addition for traders seeking to improve their trend-following performance. With its color-coded signals, real-time alerts, and clear visualization of trend reversals, it helps traders make more informed decisions without needing to watch the charts constantly. Whether you're a beginner or an experienced trader, this upgraded indicator enhances market analysis and streamlines trading decisions.
Download the indicator for MT5 today and elevate your trend analysis!
FAQ
8 Downloads
Published:
Dec 08, 2025 03:08 AM
Category: