Mastering Overextended Reversals with the Color RSI Indicator
In technical analysis, momentum oscillators serve as essential instruments for capturing market exhaustion and projecting structural pivots. Among these, the Relative Strength Index (RSI) stands out as a legendary development in tracking buying and selling velocity. However, standard iterations of this classic oscillator frequently cause execution confusion for retail traders during rapid market expansions. A basic single-color line can obscure the exact millisecond momentum reaches a critical tipping point. The Color RSI indicator provides an elegant, optimized solution for MetaTrader users, overlaying responsive visual color alerts directly onto classic momentum logic.
The Algorithmic Value of Adaptive Momentum Filtering
To sustain long-term trading consistency across liquid currency pairs like EURUSD, trading tools must deliver instant clarity. A primary limitation of traditional oscillators is that traders must constantly look back and forth between price candles and the sub-window axis to verify if a line is genuinely trading inside an extreme zone.
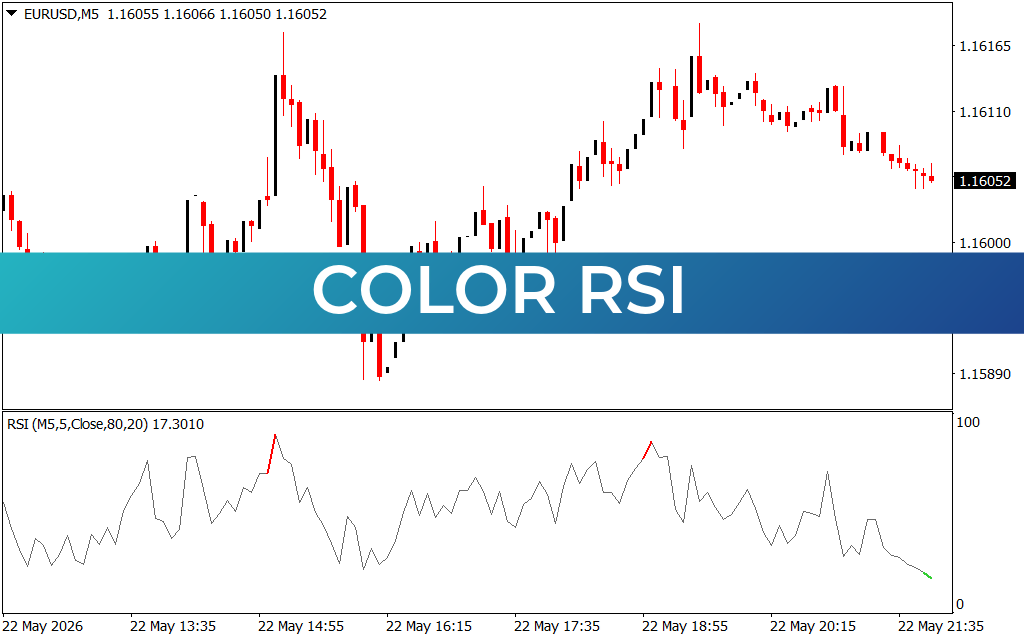
The Color RSI indicator removes this friction. By utilizing an adaptive calculation backend based on a specialized RSI(M5, 5, Close, 80, 20) mathematical configuration, it measures immediate changes in directional pressure. The calculation engine processes raw closing data over a highly responsive period, establishing extreme boundaries at the $80$ and $20$ structural thresholds. Rather than relying on human estimation, the indicator line alters its physical color properties the moment price velocity reaches a statistical overextension.
Navigating the Sub-Window Reversal Alerts
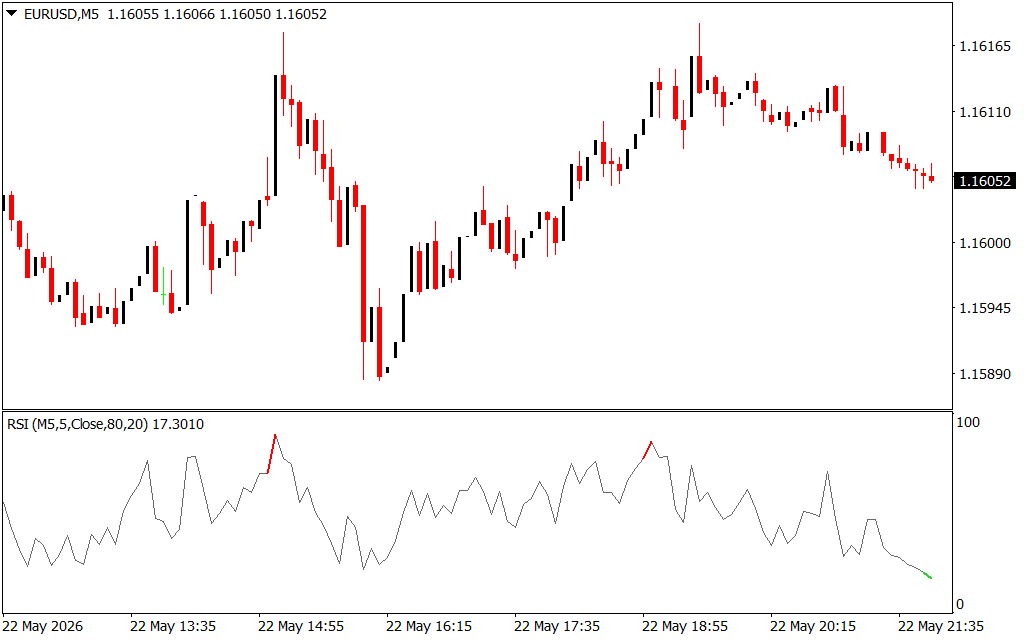
As demonstrated on the EURUSD 5-minute (M5) chart, the indicator leaves your primary candlestick workspace completely clean, anchoring its real-time analytics within an organized sub-window pane. The line moves fluidly across a standardized $0$ to $100$ scale, utilizing an intuitive color matrix to signal immediate trade viability:
- The Neutral Grey Zone: When the oscillator travels smoothly between the $20$ and $80$ levels, the line remains a solid grey color. This alerts day traders and scalpers that momentum is bound within normal structural parameters, filtering out low-probability entries during choppy intraday ranges.
- The Crimson Overbought Alert: The moment buying velocity drives the indicator line above the extreme $80$ threshold, the line transitions into a bright red signal. This warns you that the markup phase is statistically overextended and vulnerable to institutional distribution.
- The Emerald Oversold Pocket: Conversely, when aggressive markdown volume dumps the line below the $20$ baseline, the line flashes green. This serves as a definitive visual confirmation that short-term selling liquidity has dried up, clearing the path for an impending bullish mean-reversion move.
Building an Objective Execution Strategy
The Color RSI indicator functions as an exceptional cornerstone layer for both automated and discretionary trading systems, pairing seamlessly with Smart Money Concepts (SMC) or Support And Resistance strategies.
For maximum discipline, an operator can wait for Price Action to sweep a major daily liquidity pool or test a key order block. If the Color RSI line concurrently probes an extreme threshold and flashes bright red or green, it delivers an objective, data-backed signal to execute. By removing human hesitation from momentum scanning, this tool empowers you to manage risk with total mathematical precision.
3 Downloads
Last Update:
May 24, 2026 02:26 AM
Published:
Jan 15, 2026 19:45 PM
Category: