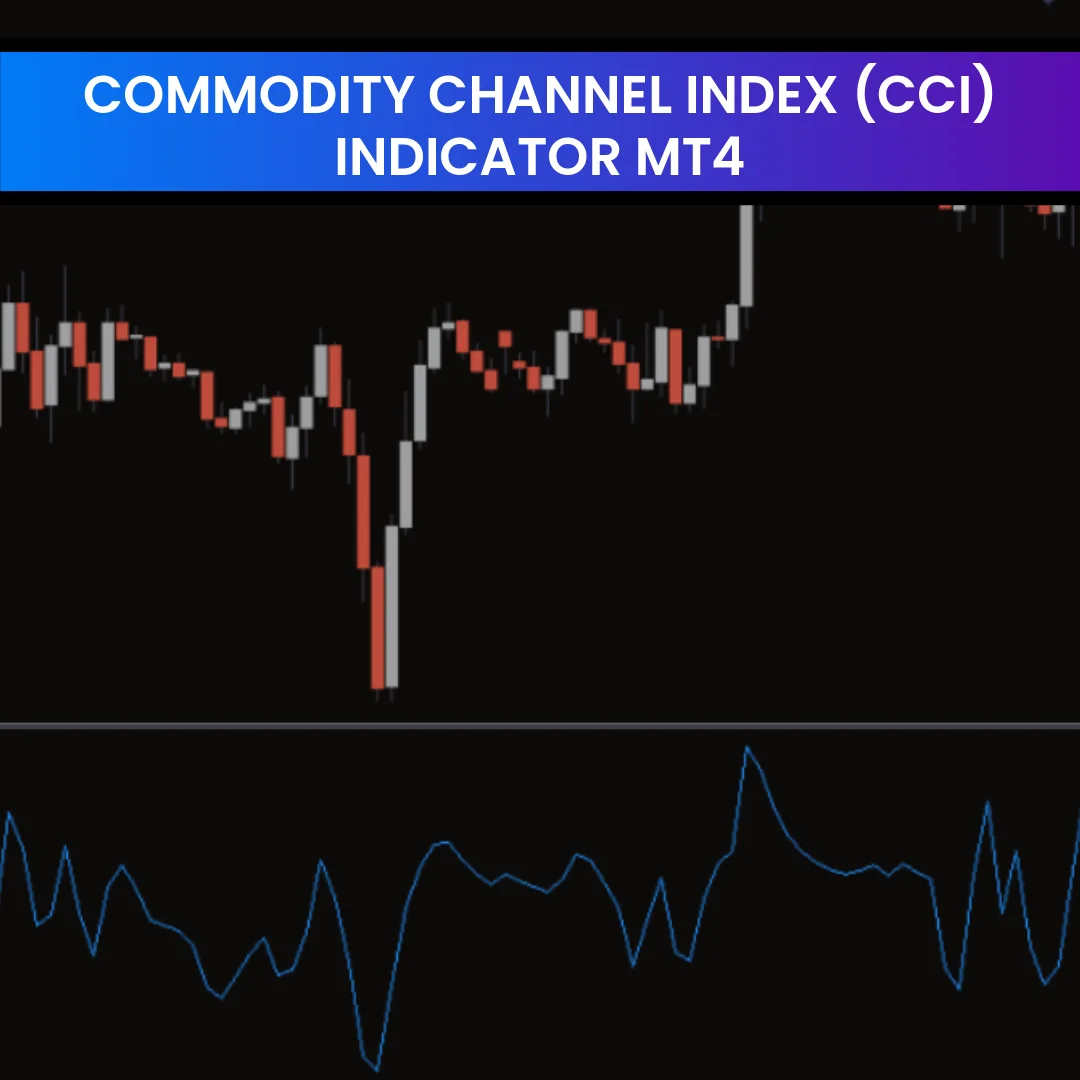
The Commodity Channel Index (CCI) Indicator is one of the most popular forex trading tools for identifying trend reversals and momentum changes. Developed by Donald Lambert, the CCI measures the difference between the current price and its statistical average over a defined period.
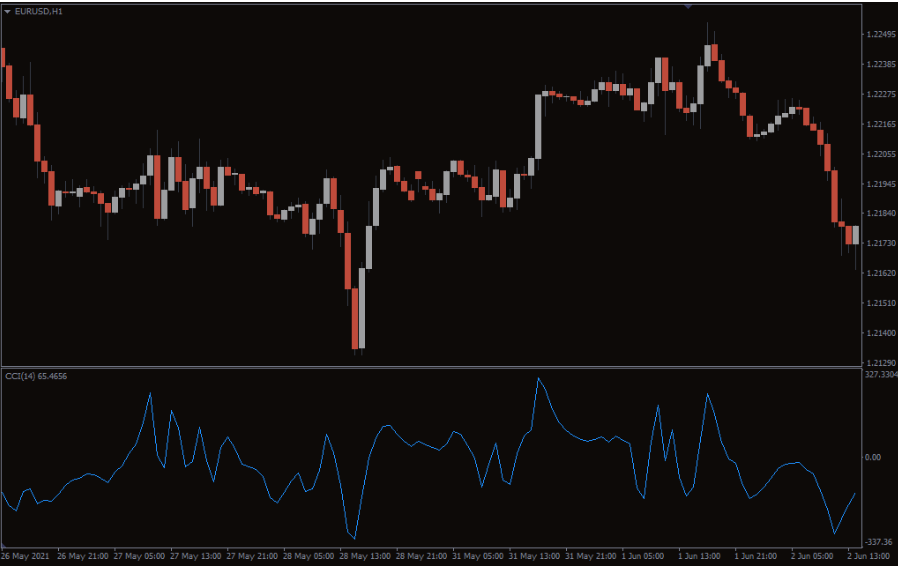
In MetaTrader 4 (MT4), the CCI indicator is widely used by both beginner and professional traders to spot divergences, overbought, and oversold market conditions. At IndicatorForest.com, you can easily download the Commodity Channel Index Indicator for MT4 and enhance your technical analysis toolkit.
How the Commodity Channel Index Works
The CCI is an oscillator that fluctuates above and below a zero line. Typically, values above +100 suggest that the price is in an overbought condition, while readings below –100 indicate an oversold condition.
The formula compares the current price with its moving average and expresses the deviation as a multiple of the mean deviation. This makes the CCI extremely useful in spotting price extremes and predicting trend reversals before they occur.
Interpreting CCI Buy and Sell Signals
The centerline (0) of the Commodity Channel Index acts as a neutral point. When the CCI crosses above zero, it’s generally considered a bullish signal, indicating potential buying opportunities. Conversely, when it moves below zero, it often signals that selling pressure is increasing.
Buy Signal Example:
When the CCI rises from below –100 and crosses above –100, it suggests that the downtrend is losing momentum and buyers are stepping in.
Sell Signal Example:
If the CCI drops from above +100 to below +100, it implies the market may be entering a correction phase as sellers gain control.
Remember, no indicator is perfect. Combine the CCI indicator with Price Action, Support And Resistance zones, or other algorithmic trading tools for better accuracy.
Using CCI to Detect Divergence
One of the most powerful uses of the Commodity Channel Index indicator is spotting divergence — when the price moves in one direction, but the indicator moves in another.
Bullish Divergence: Price makes a lower low, while the CCI makes a higher low. This often signals a potential upward reversal.
Bearish Divergence: Price reaches a higher high, but the CCI prints a lower high, suggesting a possible downtrend ahead.
At IndicatorForest.com, you’ll find free and premium algorithmic trading tools that complement the CCI, helping you automate your trading strategies.
Why Use the CCI Indicator for MT4
Here are key benefits of using the Commodity Channel Index for MT4:
Easy to interpret: Simple graphical representation of market strength and weakness.
Flexible: Works across different markets—forex, commodities, and indices.
Unbounded range: Unlike RSI, the CCI has no fixed limits, allowing greater sensitivity to price movements.
Ideal for both beginners and pros: New traders can identify entry/exit points, while seasoned traders can analyze divergence and market cycles.
For best results, use the CCI in conjunction with other MT4 indicators like Moving Averages or Bollinger Bands.
Practical Trading Tips
Set Levels at +100 and –100 to identify overbought and oversold zones.
Confirm with Candlestick Patterns before entering trades.
Avoid false signals by checking longer timeframes.
Use stop-loss orders to manage risks effectively.
Want to optimize your forex trading setup? Visit IndicatorForest.com to download the Commodity Channel Index Indicator for MT4 – free of charge and explore other advanced algorithmic trading tools.
Conclusion
The Commodity Channel Index (CCI) Indicator for MT4 remains an essential technical analysis tool for detecting trend reversals, divergences, and momentum shifts. Whether you’re a novice or a professional forex trader, mastering this indicator can significantly improve your decision-making and market timing.
FAQ
The Commodity Channel Index (CCI) Indicator MT4 measures the deviation of price from its statistical mean. It helps identify overbought and oversold conditions by comparing current price to its average price over a specified period. CCI oscillates around a zero line, with extreme values indicating potential reversals or trend continuations.
When CCI is above +100, it typically indicates overbought conditions suggesting potential downward reversals. When it's below -100, it indicates oversold conditions suggesting potential upward reversals. CCI crossing above or below the zero line can also signal trend changes. Extreme CCI values (above +200 or below -200) indicate very strong momentum.
Enter buy trades when CCI crosses above -100 from oversold conditions, indicating potential upward momentum. Enter sell trades when CCI crosses below +100 from overbought conditions, indicating potential downward momentum. Always confirm with price action, support/resistance levels, or trend direction to avoid false signals during strong trends.
CCI is effective because it identifies when price has deviated significantly from its average, which often precedes reversals or strong trend continuations. Unlike RSI or Stochastic, CCI has no upper or lower bounds, allowing it to show extreme momentum conditions that other oscillators might miss.
The indicator works on all MT4 timeframes and currency pairs, making it suitable for scalping, intraday trading, and swing trading strategies. Many traders prefer using it on H1 and H4 charts where CCI signals are clearer, though it can also be effective on shorter timeframes when combined with proper confirmation.
Published:
Dec 14, 2025 00:43 AM
Category: