The Coppock Curve Indicator is a classic oscillator developed by economist Edwin “Sedge” Coppock in 1965 by order of the Episcopal Church. Originally designed for long-term stock market investments, it helps traders identify potential buying opportunities on daily charts. However, it can also be applied to intraday charts, including hourly or 4-hour timeframes.
How the Coppock Curve Indicator Works
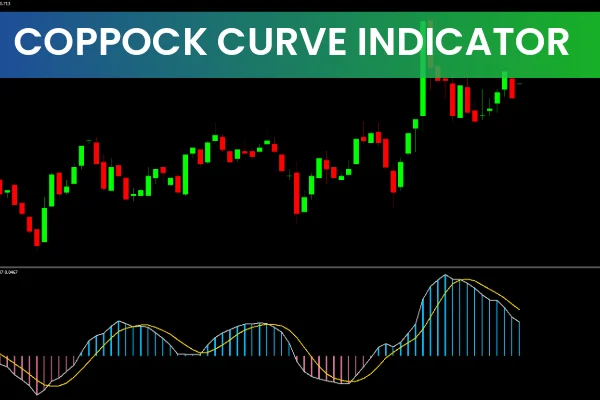
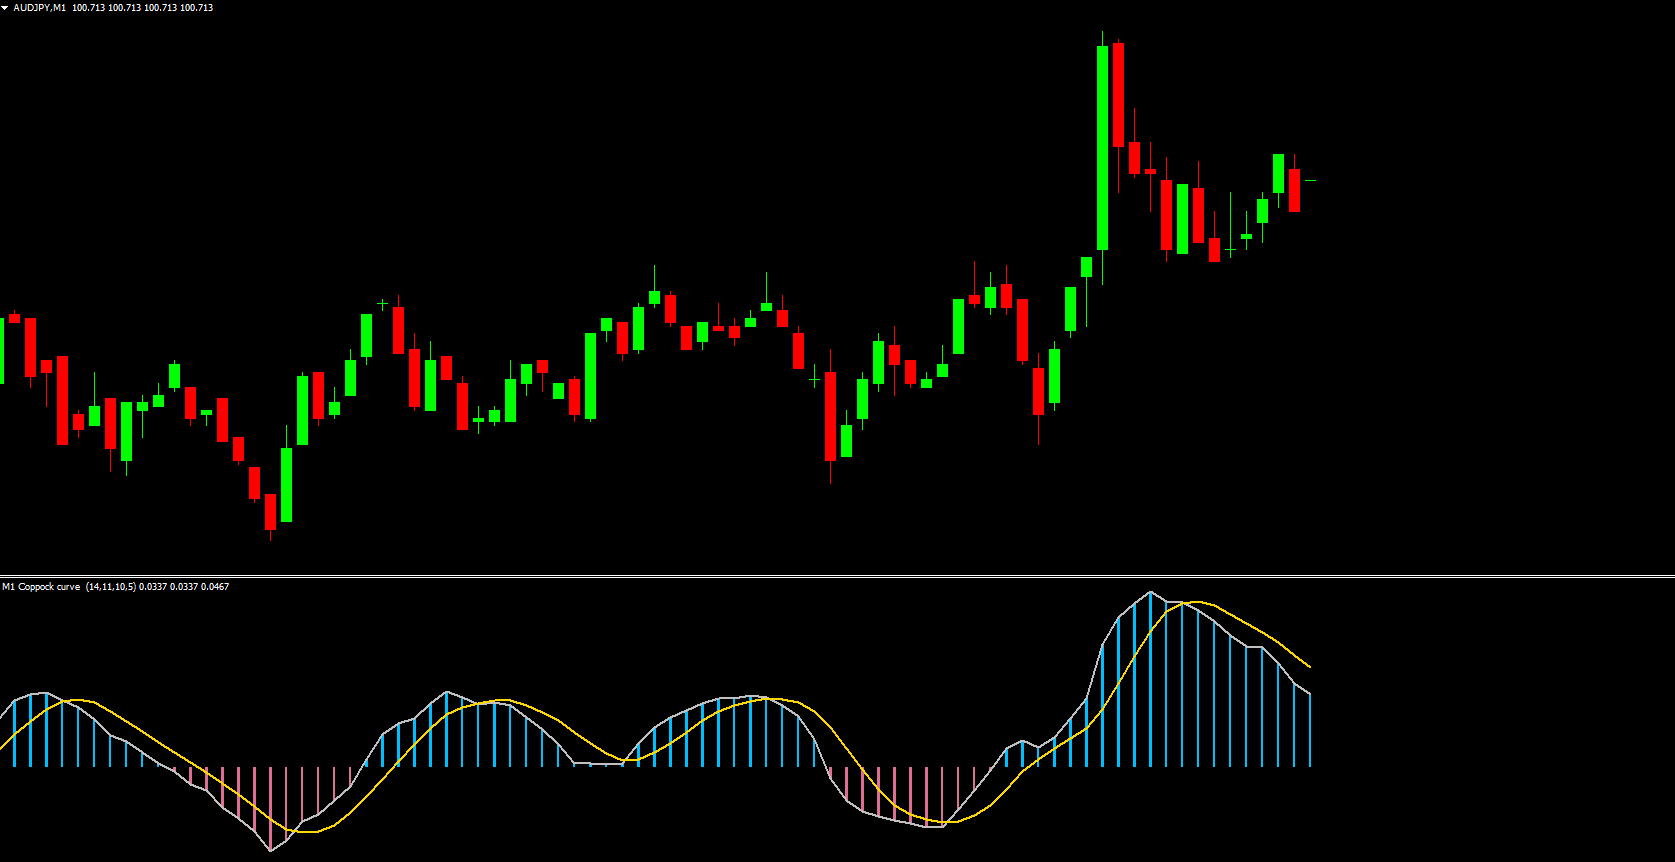
The Coppock Curve is based on the Rate of Change (ROC) and is a smoothed impulse indicator. In this MT4 version, the indicator includes:
Gray main line: Represents the original Coppock Curve.
Gold moving average: Smooths the main line for easier trend interpretation.
Two-color bar histogram: Shows whether the Coppock Curve is rising or falling and whether it is above or below zero.
Classic Trading Signals
Zero Line Cross (Buy Signal):
When the Coppock Curve crosses the zero level from bottom to top, it signals a potential long entry. Traditionally used for long-term positions, this signal can be adapted for intraday forex trading.
Moving Average Cross:
A sell signal occurs when the main Coppock Curve (gray) crosses the gold moving average from top to bottom. This can indicate a reversal or a short-term downtrend.
Divergence Signal:
If higher highs in price correspond to lower highs in the Coppock Curve, it may indicate weakening momentum and a potential reversal. Traders can use this signal to exit positions or open counter trades.
Example Trades
Buy Setup: On a USD/JPY H4 chart, the main line crosses above zero, signaling a potential buy. Position management can be based on your own rules or trailing stops.
Sell Setup: On an EUR/CHF intraday chart, the gray line crosses the gold moving average from top to bottom. Stop-loss is set above recent highs.
Additional Signal: On AUD/JPY, divergence appears with price making higher highs while Coppock Curve makes lower highs, suggesting a potential sell opportunity.
Advantages of the Coppock Curve Indicator
Provides buy and sell signals.
Three types of signals: zero line crossing, moving average crossing, divergence.
Non-repainting.
Free download.
Simple to set up.
Works on daily, weekly, monthly, and intraday charts for both forex and stock markets.
Disadvantages
No arrows displayed on the chart.
May be less effective in fast-paced, automated trading environments.
Conclusion
The Coppock Curve Indicator for MT4 is a versatile oscillator that smooths the ROC impulse indicator and provides clear trading signals. While it was originally designed for long-term stock investments, it can be adapted for forex intraday and swing trading. Combine it with other indicators or Price Action strategies and test thoroughly before live trading.
Download the Coppock Curve Indicator for MT4 for free at IndicatorForest.com and enhance your trading analysis.
FAQ
4 Downloads
Published:
Nov 11, 2025 23:44 PM
Category: