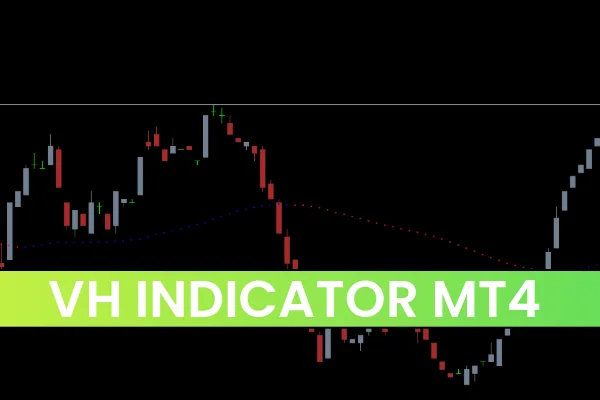
The VH Indicator for MT4 is a trend-following tool specifically designed to help forex traders identify BULLISH and BEARISH market conditions with clarity. It displays continuous colored dots directly on the chart, visually marking the direction of the prevailing trend. Because the indicator simplifies trend identification, traders can easily determine whether to BUY or SELL based on the color of the dots.
Both beginner and advanced traders benefit from this indicator. New traders can quickly spot the trend direction without relying on complicated chart patterns. Meanwhile, experienced traders can use it as a standalone trend signal or combine it with oscillators and additional indicators to build a complete trading system.
How the VH Indicator Works
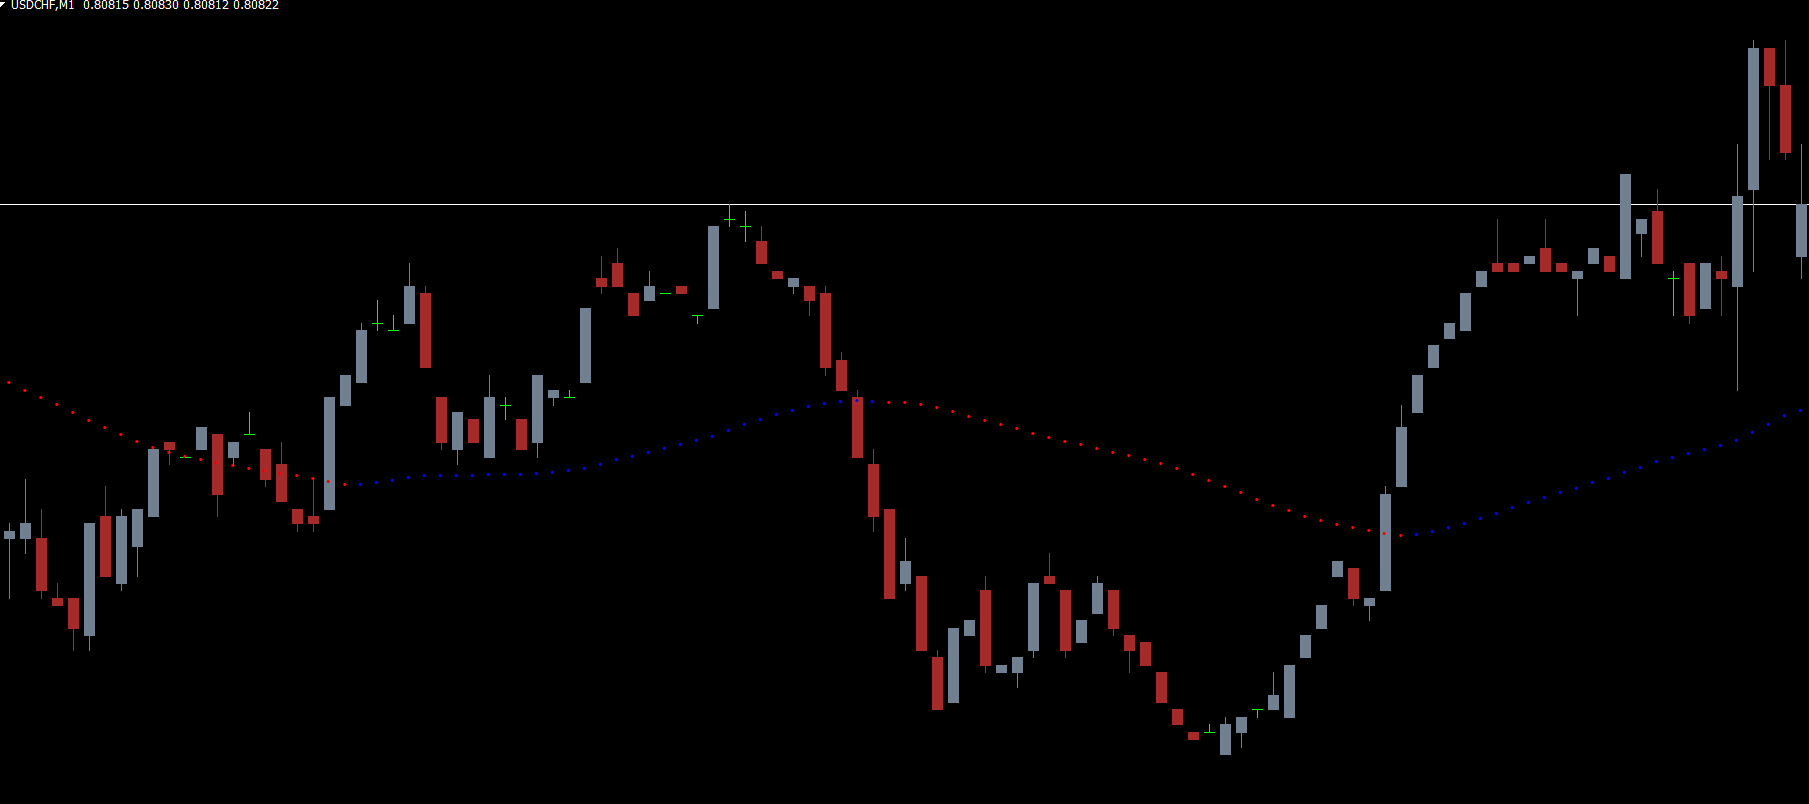
The indicator uses a combination of internal algorithms and trend-based metrics to detect the dominant market direction. Instead of using traditional moving averages or Price Action alone, it converts the trend into easy-to-read BLUE and RED dots:
BLUE dots → BULLISH trend forming or continuing
RED dots → BEARISH trend forming or continuing
As the dots shift from one color to another, traders can instantly see when a new trend begins. This visual simplicity is what makes the VH Indicator popular among technical forex traders.
Because the indicator smooths out market noise, it avoids giving too many false reversals—a common problem in lower timeframe trading.
Why the VH Indicator Is Useful for Forex Traders
Easy Trend Recognition
Trend identification is one of the most important skills in forex trading. The VH Indicator simplifies this by plotting only the essential information—trend direction through color-coded dots.
Suitable for All Trading Levels
New traders benefit from straightforward signals
Advanced traders can integrate it into multi-indicator systems
Scalpers, day traders, and swing traders can use it across all timeframes
Ideal for Multi-Timeframe (MTF) Strategies
Because trends on higher timeframes are more stable, traders can check the VH Indicator on the H4, Daily, or Weekly chart to identify the dominant trend, and then enter trades on lower timeframes using the same direction. This increases accuracy and improves risk-reward ratios.
Free and Easy to Install
The indicator is lightweight, simple to configure, and freely available for download.
VH Indicator for MT4 Trading Signals
Bullish Trading Signal (BUY)
A BUY signal occurs when the indicator’s dots turn BLUE. This indicates the start of a BULLISH trend or a continuation of an existing uptrend.
How to Trade It:
Enter a BUY trade when the dots first turn BLUE
Set your stop-loss below the previous swing low
Close the trade when the dots change back to RED
Take Profit can also be placed at a recent resistance level or opposite signal
Bearish Trading Signal (SELL)
When the dots switch to RED, the indicator signals a BEARISH trend.
How to Trade It:
Enter a SELL trade when RED dots appear
Place your stop-loss above the previous swing high
Hold the position until the dots change color to BLUE
Alternatively, take profit near strong support or the opposite signal
These signals work efficiently on M15, H1, H4, Daily, and even Weekly charts.
Using the VH Indicator in Multi-Timeframe Trading
The indicator performs well in all intraday and higher timeframes, making it suitable for a multi-timeframe analysis approach.
Example Strategy:
Use the Daily chart to determine the primary trend (BLUE for bullish, RED for bearish).
Switch to the H1 or M30 chart to find a precise entry in the direction of the main trend.
Use previous swing lows or highs for stop-loss placement.
Exit when the dot color changes, signaling a Trend Reversal.
This combined approach reduces false signals and enhances long-term trading consistency.
Conclusion
The VH Indicator for MT4 is an essential tool for forex trend traders. Its simple color-coded dot system makes it easier to spot BULLISH and BEARISH trends, allowing traders to BUY or SELL confidently and stay in trades until the trend ends. Suitable for all skill levels and compatible with any forex technical strategy, the indicator is free to download and easy to install.
To access more free MT4 and MT5 indicators, visit IndicatorForest.com today.
FAQ
Published:
Nov 21, 2025 20:54 PM
Category: