Mastering Correlation and Momentum with a Currency Strength Meter
In the modern financial landscape, trading an individual currency pair in a vacuum is a recipe for poor performance. Every asset cross is a tug-of-war between two distinct global economies. For example, when analyzing the EUR/USD 1-hour (H1) chart, simply looking at the candlesticks won’t tell you whether a massive price surge is driven by genuine Euro demand or broad-based US Dollar weakness.
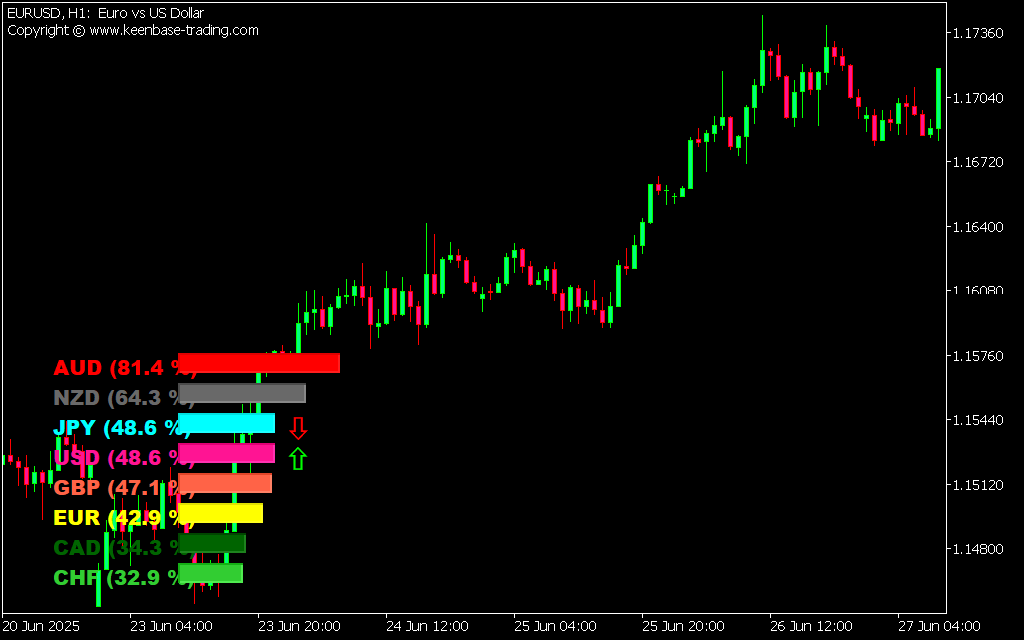
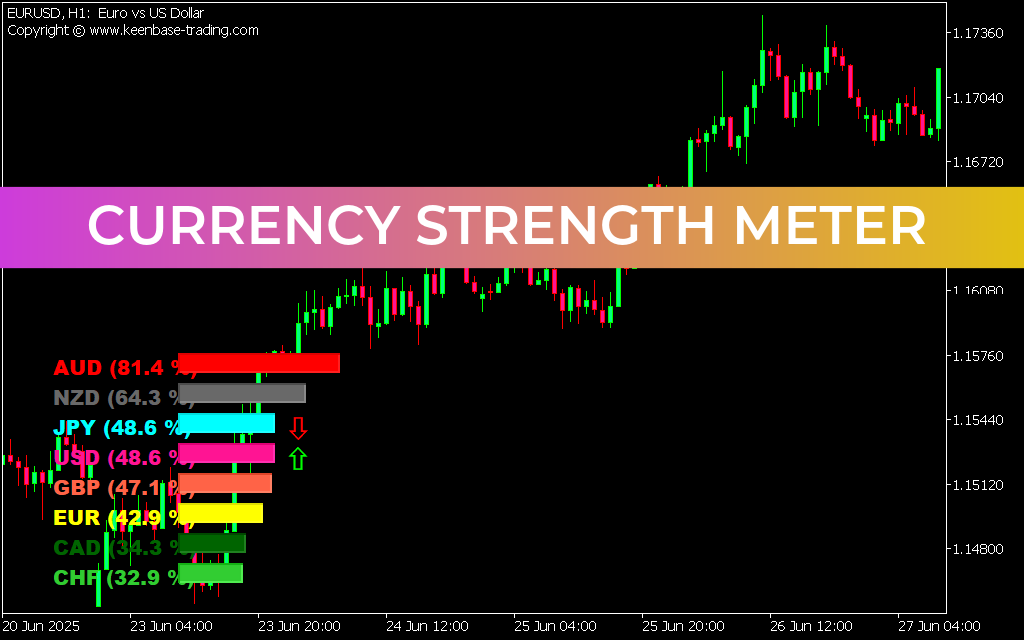
Looking closely at the H1 price delivery from late June, the asset transitioned from a choppy, low-volume consolidation floor near 1.14800 into an explosive, vertical uptrend that shattered multiple local resistance barriers to peak above 1.17360. Retail traders trying to short this aggressive rally based purely on overbought oscillators got aggressively run over by institutional order flow. To capitalize on these powerful trend extensions without getting caught on the wrong side of the market, professional traders use a dedicated Currency Strength Meter to instantly diagnose relative value across the global matrix.
Uncovering the Hidden Flow of Global Capital
A currency strength dashboard completely revolutionizes your technical analysis layout by shifting your focus from isolated price charts to relative currency performance. By processing real-time transactional tick data across all the major financial crosses, the indicator algorithm isolates the individual velocity of each major currency—including the USD, EUR, AUD, GBP, JPY, NZD, CAD, and CHF.
As visualized on the EUR/USD H1 chart during this historic markup phase, tracking relative percentage scores offers undeniable strategic advantages:
- Spotting Strong vs. Weak Pairings: The indicator panel clearly highlights a massive divergence in capital allocation, such as an exceptionally strong currency like the AUD at 81.4% contrasted against a severely depressed asset like the CHF at 32.9%. Pairing the absolute strongest asset with the absolute weakest currency triggers a high-probability trade with massive momentum potential.
- Confirming Structural Breakouts: When the EUR/USD began its vertical expansion, a quick glance at the dashboard would confirm whether the move was backed by true Euro capital inflows or simple Dollar distribution, giving you the conviction to hold your trend-following positions for maximum pip gains.
Streamlining Your Technical Workflow
Attempting to cross-reference multiple timeframes and currency crosses manually causes immediate cognitive overload and costly execution lag. Utilizing an automated visual matrix directly on your primary platform layout condenses complex market correlation data into clean, actionable data streams. By integrating an institutional-grade strength meter into your MetaTrader workspace, you strip away the guesswork of technical analysis. You can effortlessly filter out low-probability range environments, avoid entering fakeouts, and align your portfolio with real-time institutional volume.
4 Downloads
Last Update:
May 20, 2026 15:49 PM
Published:
Jan 18, 2026 19:11 PM
Category: