The Time Indicator for MT5 is a simple yet powerful forex tool designed to help traders execute trades with perfect timing. It displays both local time (your computer’s time zone) and server time (your broker’s time zone) directly on your chart.
Because the forex market operates 24 hours a day across different time zones, this indicator ensures that traders always know exactly what time it is—both locally and on the broker’s server. This is especially helpful when timing trades around high-volatility events, such as London–New York session overlaps or economic news releases.
Why the Time Indicator Matters
Volatility in the forex market tends to spike during specific trading hours — for example, when major sessions overlap or when key economic data is released. Professional traders understand the importance of timing and use tools like the Time Indicator to:
Align trade entries with high-liquidity market sessions.
Track upcoming news events and adjust positions accordingly.
Avoid low-volatility periods or market inactivity.
The indicator makes it easy to track these sessions in real time, ensuring you’re always trading when the market is most active.
How the Time Indicator Works
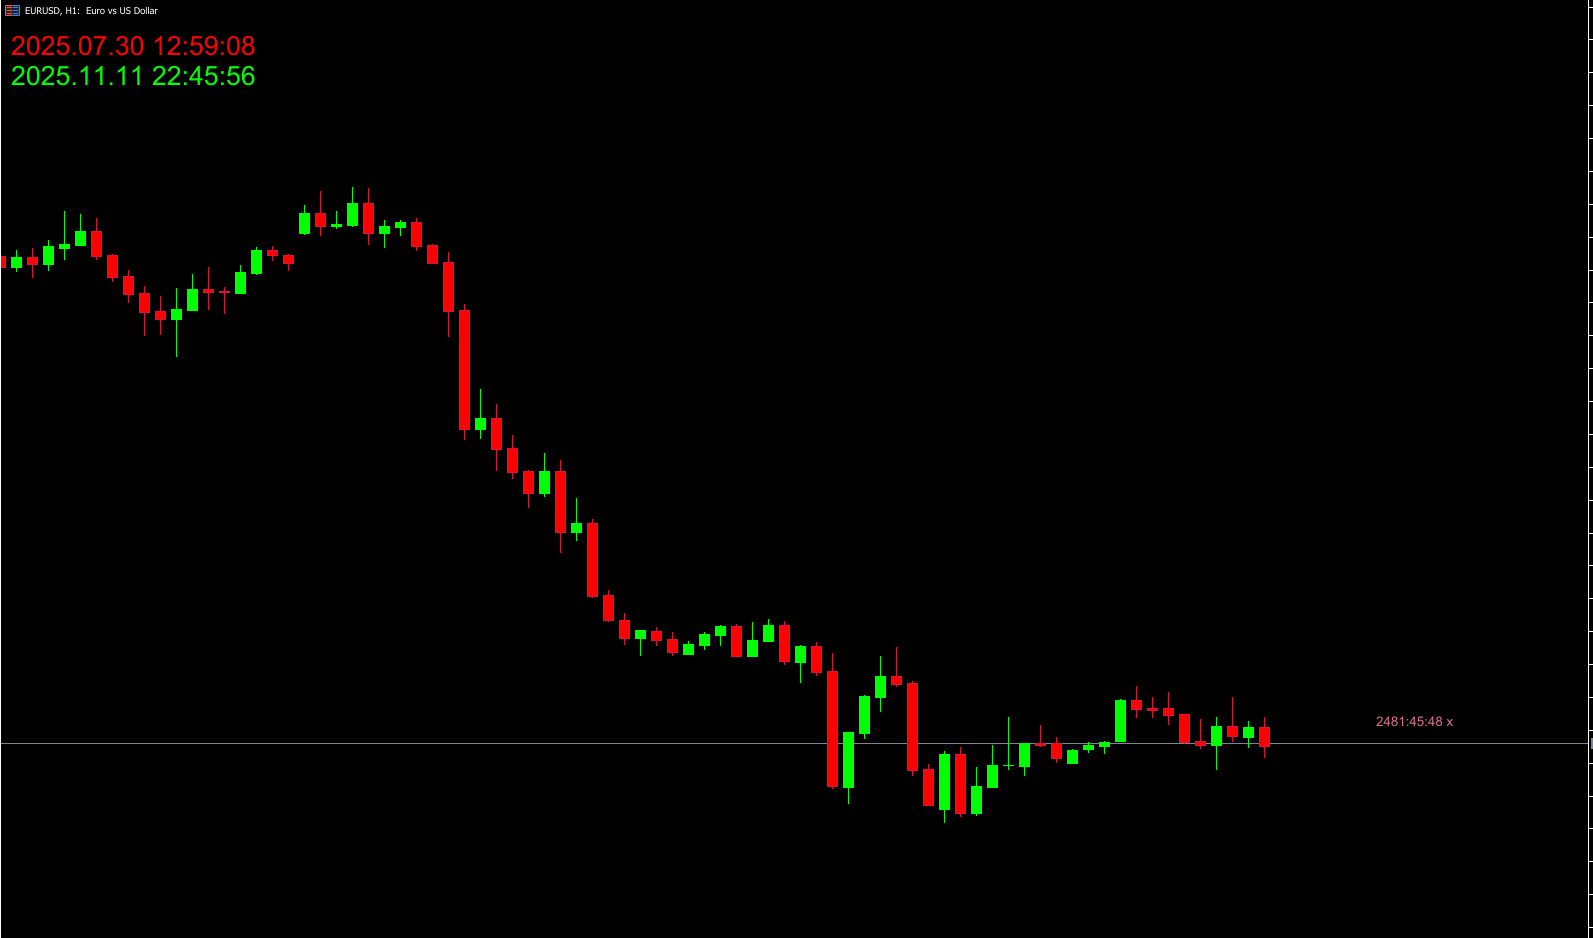
The indicator automatically displays two different clocks on your MT5 chart:
Local Time (Lime color): Reflects the trader’s system or regional time zone.
Server Time (Red color): Represents your broker’s server time zone.
In the EUR/USD H4 example below, both times are displayed clearly on the chart. This dual-time feature ensures traders can synchronize their analysis and orders accurately, especially when trading during major session overlaps (London/New York) or scheduled economic releases.
Who Should Use the Time Indicator
This indicator is suitable for all types of forex traders, but it’s especially valuable for:
News Traders: To monitor and prepare for market-moving events.
Scalpers & Intraday Traders: To trade during high-liquidity hours.
Technical Traders: To identify optimal times to avoid sideways or low-volume markets.
Since the indicator doesn’t provide buy or sell signals, it’s purely an informational tool designed to enhance your trade timing strategy.
Best Practices
To make the most of the Time Indicator for MT5:
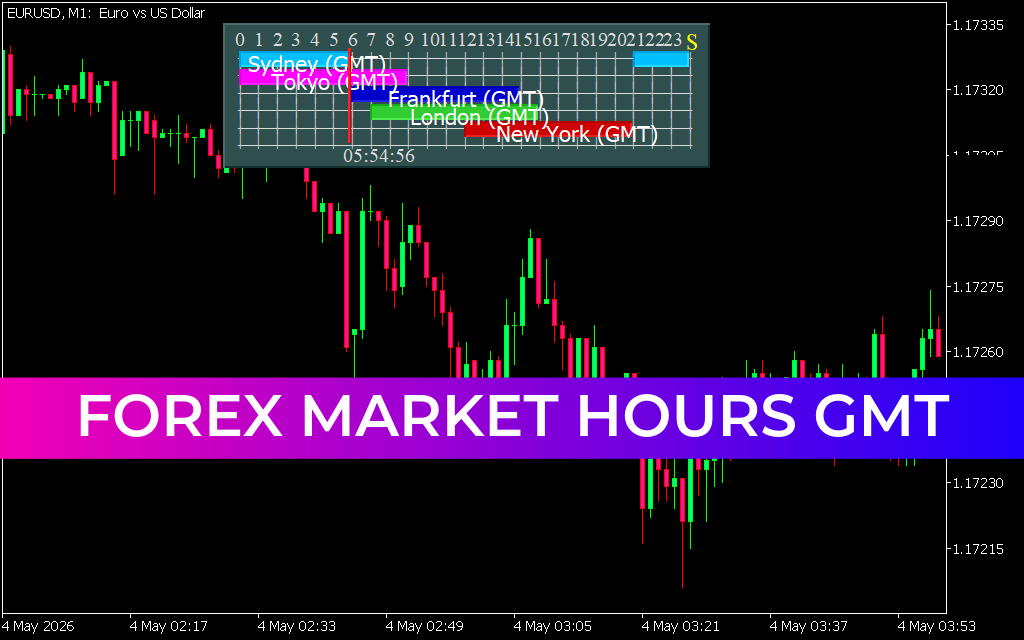
Combine it with the FXR Time Indicator to visualize current market sessions (Tokyo, London, New York).
Use an Economic Calendar indicator to track upcoming high-impact news events.
Avoid using the Time Indicator as a standalone trading tool—it does not provide momentum, volatility, or trend information.
Practice aligning your trade timing with session overlaps for improved accuracy and higher potential returns.
Key Features
Displays local and broker server times on chart.
Works on all timeframes and currency pairs.
Highly customizable (font, color, and display position).
Ideal for timing news releases and session overlaps.
Lightweight and does not slow down your MT5 platform.
Conclusion
The Time Indicator for MT5 is an essential utility for traders who value precision and timing. While it doesn’t generate trade signals, it provides crucial information that helps traders enter and exit the market at the right moment.
Used in combination with the FXR Time Indicator and an Economic Calendar, this tool helps you:
Trade during volatile session overlaps.
Avoid low-activity hours.
Align your trading schedule with global market movements.
Download the Time Indicator for MT5 for free at IndicatorForest.com and start mastering your timing today.
FAQ
32 Downloads
Published:
Nov 11, 2025 12:52 PM
Category: