Custom High Low Indicator

Custom High Low Indicator
Free

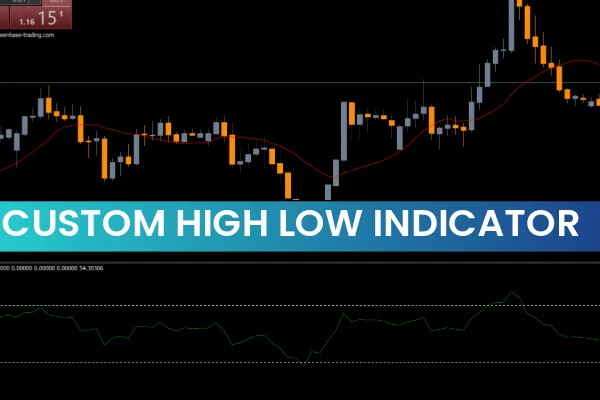
The Custom High Low Indicator for MT5 is a powerful tool that plots previous and current daily, weekly, and monthly high and low levels directly on your chart. By visualizing these critical levels, forex traders can quickly identify bullish and bearish trends across multiple timeframes. This makes it easier to plan precise entry and exit points for both buy and sell trades.

Features of Custom High Low Indicator for MT5

Displays daily, weekly, and monthly high and low levels

Highlights pivot points for trend analysis

Compatible with all MT5 timeframes

Easy to customize settings according to your trading style

Free to download and simple to install

How to Use Custom High Low Indicator in Your Trading

The indicator works seamlessly for both new and advanced traders. By combining multiple timeframe levels, traders can identify strong bullish or bearish trends. For example, pivot traders can use the high and low levels from higher timeframes to determine the trend and then execute trades on a lower timeframe for better precision.

Highs and lows of higher timeframes often represent optimal buy or sell points, helping traders enter and exit trades with minimal risk. The visual snapshot provided by the indicator allows traders to make informed decisions without constantly switching timeframes.

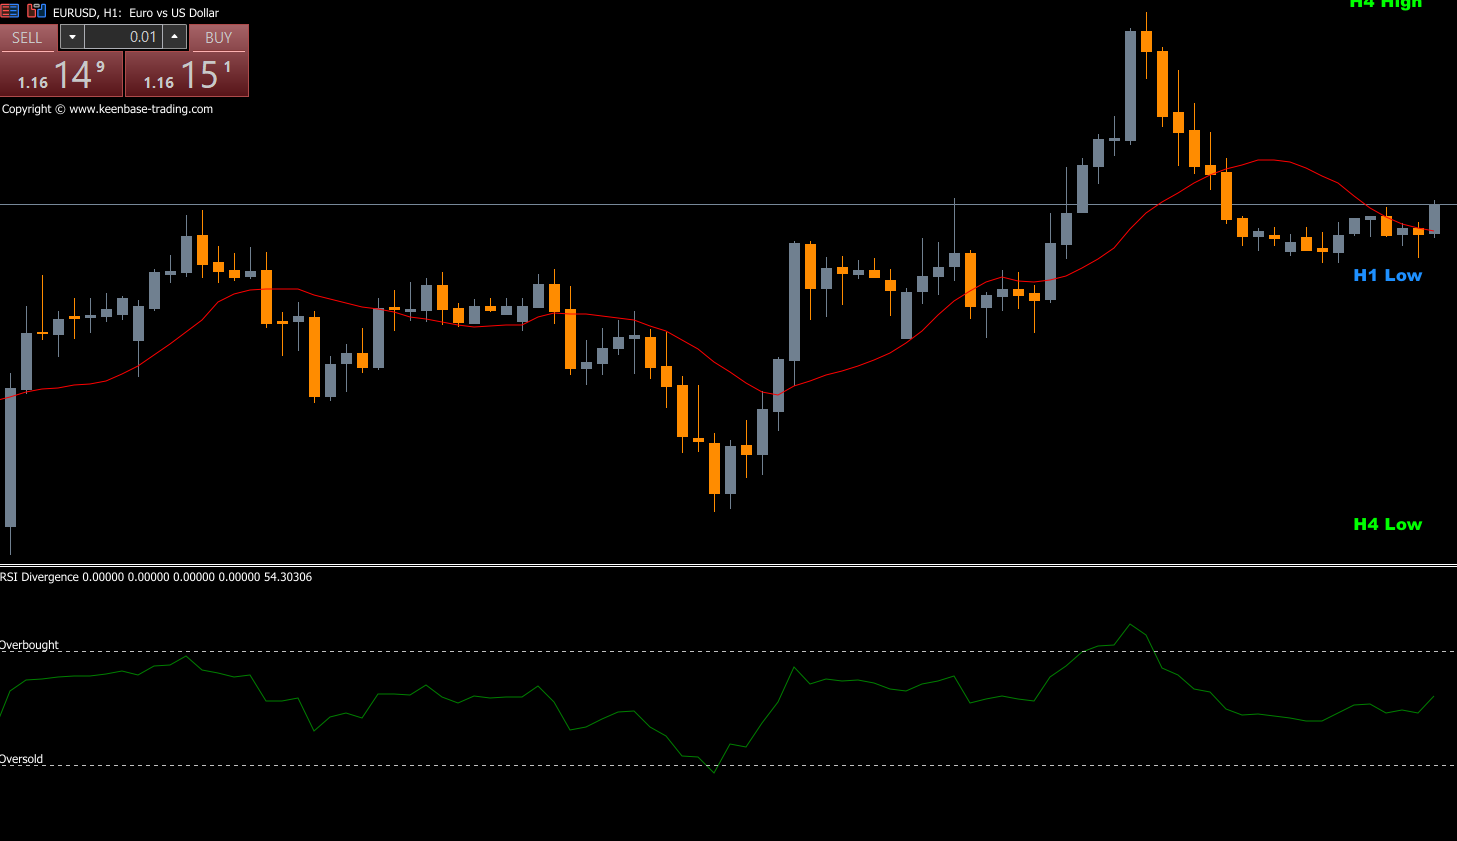
Trading Setup Example

For instance, an AUDJPY daily chart with the Custom High Low Indicator shows all necessary high and low levels along with pivot lines. Traders can identify the trend in higher timeframes and plan entries on lower timeframe charts accordingly. This method helps in both swing and position trading strategies by pinpointing strong reversal and continuation zones.

Benefits of Using the Custom High Low Indicator

Easily identifies market trends in multiple timeframes

Enhances accuracy of buy and sell entries

Works for beginners and experienced traders

Free and easy installation

Supports all forex pairs and MT5 timeframes

Conclusion

The Custom High Low Indicator for MT5 offers a comprehensive view of daily, weekly, and monthly high and low levels, allowing traders to spot bullish and bearish trends efficiently. Its multi-timeframe approach and ease of use make it a valuable tool for both beginners and advanced traders. Download it today from IndicatorForest.com and improve your forex trading strategy.

FAQ

A powerful tool for MT5 that plots previous and current daily weekly and monthly high and low levels directly on chart by visualizing these critical levels forex traders can quickly identify bullish and bearish trends across multiple timeframes making it easier to plan precise entry and exit points for both buy and sell trades with indicator displaying daily weekly and monthly high and low levels highlighting pivot points for trend analysis.

It displays daily weekly and monthly high and low levels, highlights pivot points for trend analysis, compatible with all MT5 timeframes, easy to customize settings according to trading style, and free to download and simple to install. By combining multiple timeframe levels, traders can identify strong bullish or bearish trends. Indicator works seamlessly for both new and advanced traders providing visual snapshot that allows traders to make informed decisions without constantly switching timeframes.

Highs and lows of higher timeframes often represent optimal buy or sell points helping traders enter and exit trades with minimal risk. For instance, AUDJPY daily chart with Custom High Low Indicator shows all necessary high and low levels along with pivot lines. Traders can identify trend in higher timeframes and plan entries on lower timeframe charts accordingly. This method helps in both swing and position trading strategies by pinpointing strong reversal and continuation zones. Pivot traders can use high and low levels from higher timeframes to determine trend and then execute trades on lower timeframe for better precision.

It easily identifies market trends in multiple timeframes, enhances accuracy of buy and sell entries, works for beginners and experienced traders, free and easy installation, and supports all forex pairs and MT5 timeframes. By visualizing critical levels directly on chart, traders can quickly identify bullish and bearish trends across multiple timeframes making it easier to plan precise entry and exit points making it valuable tool for traders seeking multi-timeframe high and low level analysis.

Indicator plots previous and current daily weekly and monthly high and low levels directly on chart providing multi-timeframe approach that standard high/low indicators typically do not offer. By visualizing these critical levels across multiple timeframes, forex traders can quickly identify bullish and bearish trends. Highs and lows of higher timeframes often represent optimal buy or sell points helping traders enter and exit trades with minimal risk. This multi-timeframe visualization allows traders to make informed decisions without constantly switching timeframes.
2 Downloads

Published:

Dec 02, 2025 02:22 AM

Category:

We use cookies to personalize your experience. By continuing to visit this website you agree to our use of cookies

GDPR and cookie policy