Mastering Mathematical Support and Resistance with Murrey Math Lines
Financial markets may look chaotic, but beneath the Price Action lies a rhythmic, mathematical structure. For decades, smart traders have utilized complex geometric and mathematical frameworks to predict where trends will stall, reverse, or break out. Among these frameworks, Murrey Math theory stands out as one of the most reliable ways to evaluate price behavior.
The Murrey Math Lines indicator brings this powerful mathematical system directly to your trading terminal, eliminating tedious manual formulas and drawing precise, automated Support And Resistance levels.
What is the Murrey Math Lines Indicator?
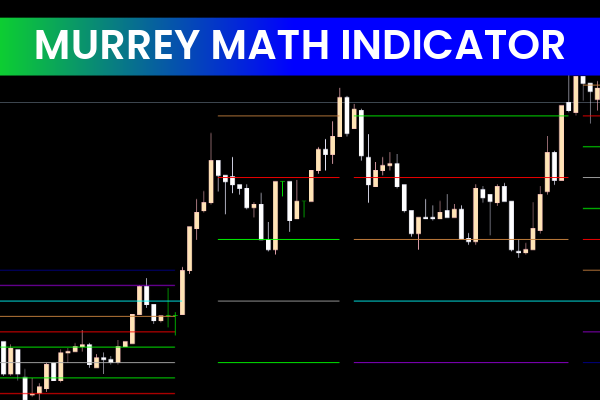
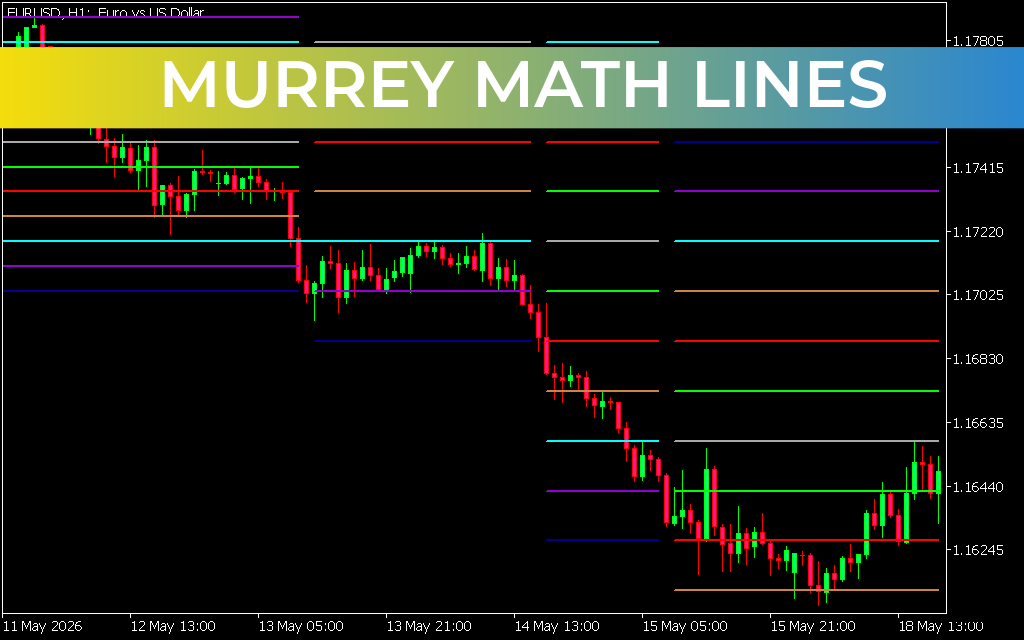
The Murrey Math Lines indicator is a technical tool based on the trading philosophies of W.D. Gann and T. Henning Murrey. It operates on the principle that price movement repeats itself in specific harmonic increments. The indicator divides price movement into an $8 \times 8$ grid, mapping out nine critical horizontal lines on your chart.
As shown on the EURUSD H1 chart, these color-coded lines act as distinct support, resistance, and momentum boundaries. Rather than looking at random daily highs or lows, Murrey Math creates a rigid, objective grid that shows exactly how overextended or balanced an asset is at any given point in time.
Key Benefits and Core Features
- Automated Mathematical Levels: The indicator instantly calculates and draws all key mathematical pivot lines, saving you from complex mathematical calculations.
- Objective Price Classification: Each line in the Murrey Math grid has a specific property—such as the $4/8$ line acting as the ultimate center line, and the extreme $0/8$ and $8/8$ lines acting as the strongest structural walls.
- Overbought and Oversold Indicators: Lines that stretch beyond the core grid (like $+1/8$ or $-1/8$) immediately signal to the trader that price is highly overextended and due for a sharp reversal.
- Universal Timeframe Application: The indicator adapts flawlessly to any timeframe, making it an indispensable tool for fast-paced scalpers, day traders, and macro swing traders alike.
How to Trade Using Murrey Math Lines
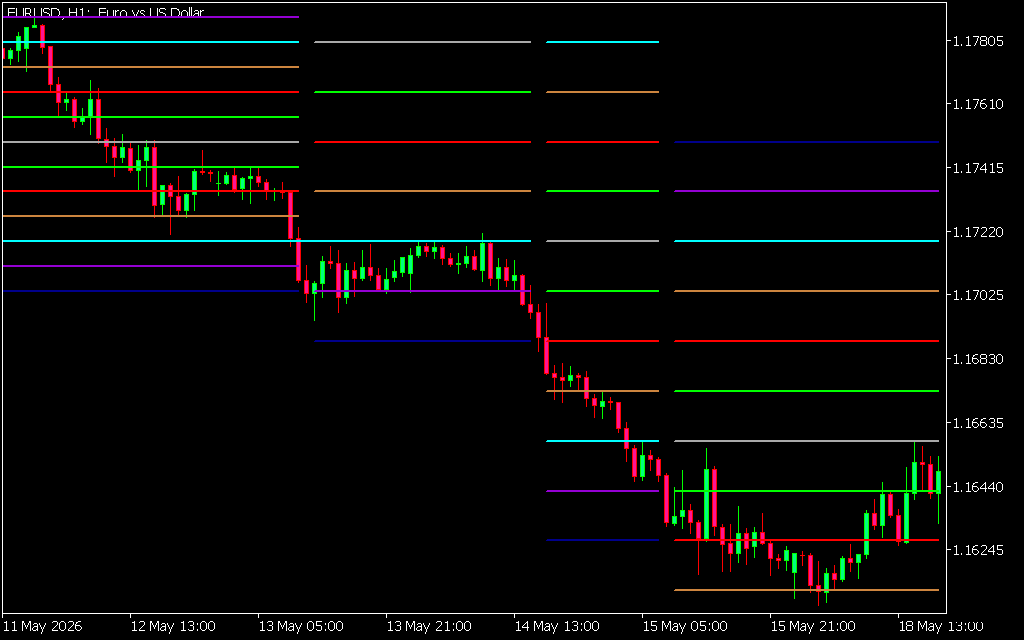
Trading with this system revolves around knowing the exact characteristics of each mathematical line. When the EURUSD price drops heavily and hits the lower, major support lines—such as the $1/8$ (weak stall) or $0/8$ (hardest line to break)—traders look for bullish Candlestick Patterns to buy the market back toward the center $4/8$ line.
Conversely, during aggressive trends, the lines serve as definitive breakout target markers. If price forcefully closes past the $5/8$ line, it signals an accumulation of momentum, suggesting that price will likely run up to the $6/8$ and $7/8$ levels next. By using these lines as predefined profit targets and stop-loss boundaries, traders can execute highly systematic, rule-based trades.
1 Download
Last Update:
May 23, 2026 01:24 AM
Published:
Jan 17, 2026 13:58 PM
Category: