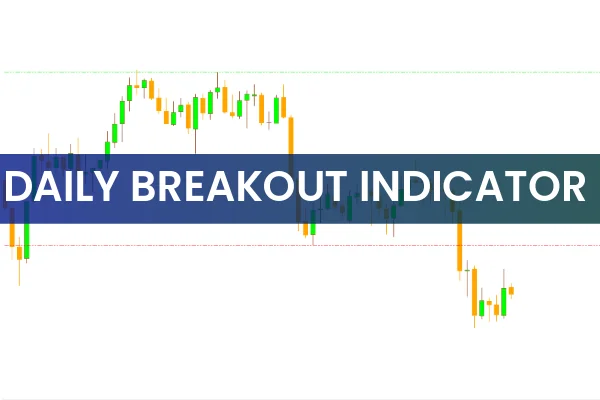
The Daily Breakout Indicator for MT4 is a simple yet powerful forex trading tool that automatically plots key Support And Resistance levels to highlight potential breakout opportunities. Breakouts are among the most reliable trading setups in technical analysis, often leading to strong market momentum and profitable price moves.
By drawing daily support and resistance lines, this indicator allows traders to visualize where price is likely to break and create new trends. It works on all timeframes, but it performs best on higher timeframes, where breakout signals are more reliable and less affected by market noise.
How the Daily Breakout Indicator Works
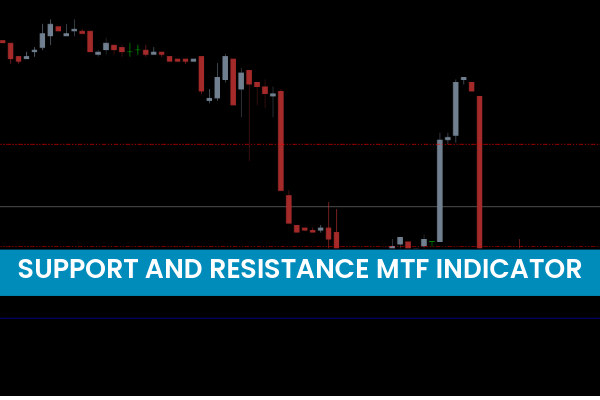
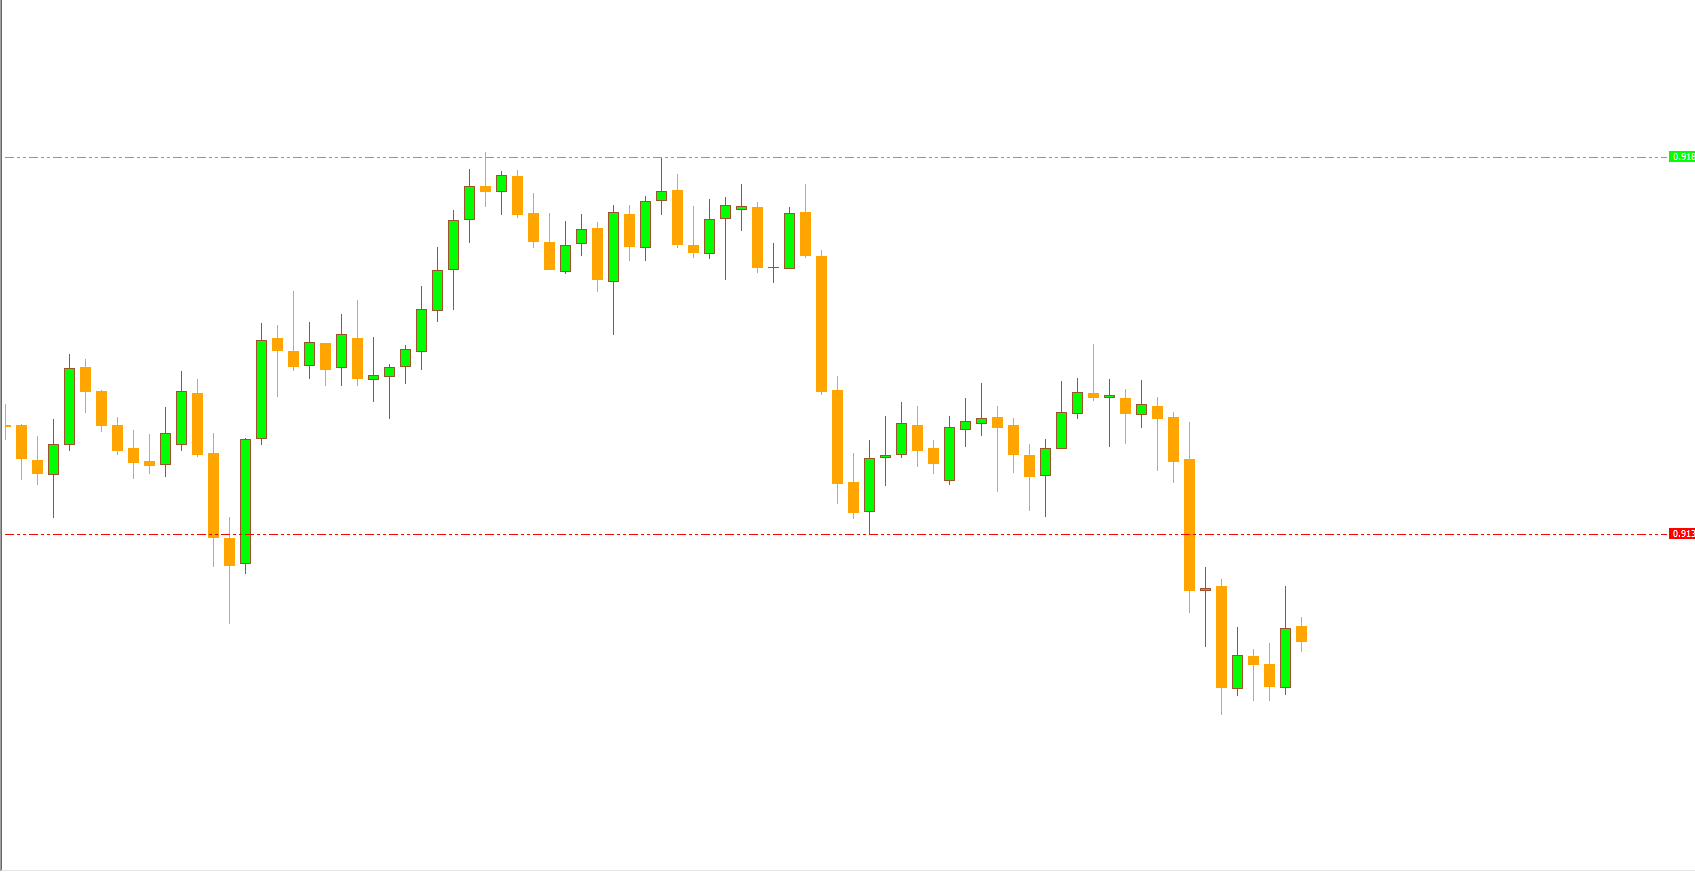
The indicator identifies daily support and resistance levels using traditional price analysis. Once plotted, these lines serve as critical price zones where the market often pauses or reverses.
The green line represents resistance, a price ceiling where sellers may step in.
The red line represents support, a price floor where buyers often enter the market.
When price breaks through these levels, it signals a possible trend continuation or reversal.
How to Use the Daily Breakout Indicator for MT4
Using the Daily Breakout Indicator is straightforward. Traders watch for price movements around the plotted levels:
Buy Signal (Bullish Breakout):
When the price breaks above the green resistance line, it indicates strong bullish momentum. Traders can open a buy position and ride the upward move.
Sell Signal (Bearish Breakout):
When the price breaks below the red support line, it signifies strong bearish pressure. Traders can open a sell position to capture the downward move.
Exit Strategy:
You can exit your trade when the price approaches the next support or resistance level, depending on the direction of your trade.
This indicator works effectively as a standalone trading system, but traders often combine it with other tools such as the Relative Strength Index (RSI), Moving Averages, or Volume indicators to confirm breakouts and reduce false signals.
Example of a Daily Breakout Setup
Suppose you’re trading EURUSD on the H4 chart. The indicator plots a green resistance line and a red support line. If the price breaks above the resistance level with strong bullish candles, it signals a buy opportunity. Similarly, if the price breaks below the support line, it triggers a sell setup.
Using confirmation tools like a bullish engulfing pattern or an RSI breakout can further validate the signal, improving trade accuracy.
Benefits of Using the Daily Breakout Indicator MT4
Automatic Level Detection: Instantly identifies daily support and resistance zones.
Accurate Breakout Signals: Helps detect potential bullish or bearish breakouts.
Adaptable: Works on all currency pairs and timeframes.
Beginner Friendly: Clear visual representation of key levels.
Time-Saving: Eliminates manual plotting of daily market levels.
Conclusion
The Daily Breakout Indicator for MT4 is a valuable tool for traders who rely on Price Action and breakout strategies. By automatically plotting daily support and resistance lines, it simplifies technical analysis and enhances trade timing.
Traders can use this indicator to identify potential buy and sell signals based on breakouts, improving precision and reducing guesswork. Whether you trade intraday or swing strategies, this indicator offers clarity and confidence in decision-making.
To download the Daily Breakout Indicator for MT4 and explore other free forex trading tools, visit IndicatorForest.com.
FAQ
2 Downloads
Published:
Nov 09, 2025 09:02 AM
Category: