Navigating the Markets with the Daily Open Indicator
In the fast-paced world of forex trading, the start of a new trading session holds immense significance. The price at which a currency pair opens for the day serves as a critical psychological anchor for institutional investors, algorithms, and retail traders alike. For MetaTrader users looking to exploit this daily structural level, the Daily Open Indicator is an indispensable addition to their technical analysis toolkit.
By automatically plotting key intraday price levels directly onto your charts, this indicator eliminates manual calculations, helping day traders and scalpers quickly decipher market bias and execute precision entries.
Understanding the Daily Open Concept
The daily open price acts as a line in the sand for intraday market sentiment. It provides a baseline from which a day's bullish or bearish momentum is measured.
- Bullish Bias: When the current price trades above the daily open line, it signals that buyers are in control, suggesting a long preference for intraday strategies.
- Bearish Bias: When the current price drops below the daily open line, it indicates that sellers are driving the market, favoring short configurations.
Because large financial institutions closely monitor how the market reacts to the opening price during major sessions (like London or New York), these lines frequently act as hidden Support And Resistance zones throughout the trading day.
Core Features and Intraday Strategies
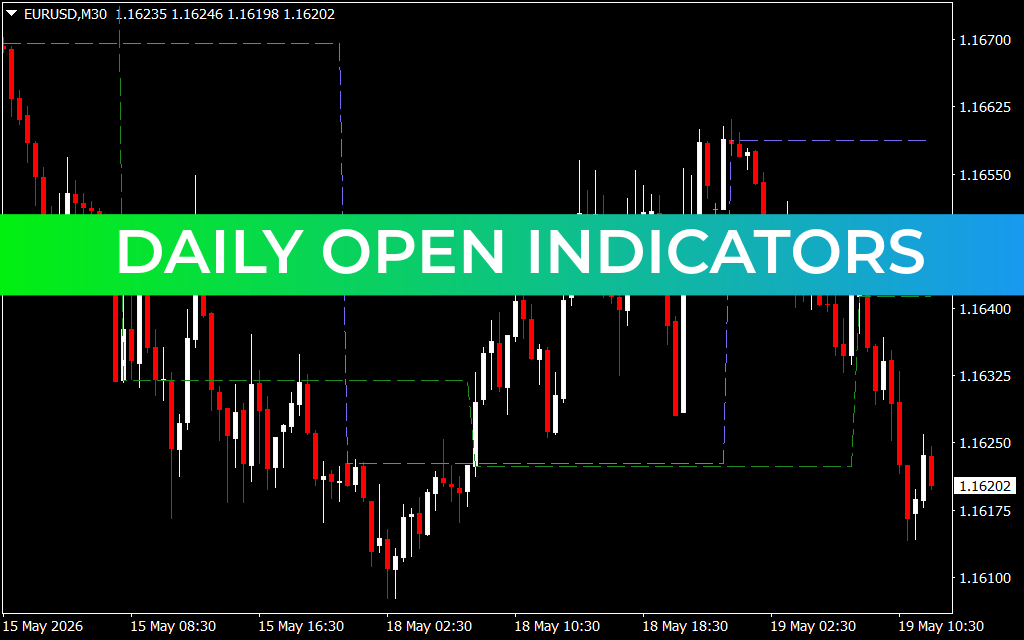
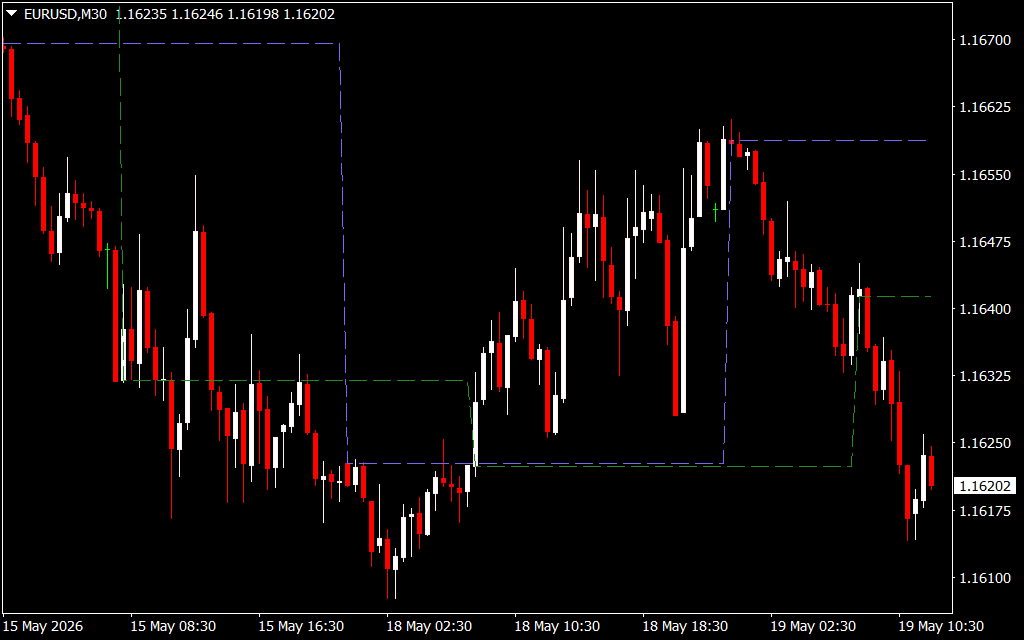
The Daily Open Indicator is designed to streamline your chart setup by projecting horizontal support and resistance boundaries based on previous session data. As seen on timeframes like the 30-minute (M30) chart, it helps traders map out structural shifts.
1. Breakout Trading
A popular strategy involves waiting for the price to break forcefully above or below the daily open level after a period of early-morning consolidation. A clean breakout, paired with a surge in volume, often marks the beginning of a strong intraday trend.
2. The Pullback and Rejection
Markets rarely move in straight lines. Often, the price will break away from the daily open line and later return to retest it. If the price pulls back to the daily open level and shows signs of rejection (such as a long candlestick wick), traders can utilize this level as a high-concurrency entry point with tight stop-loss placement.
3. Session Range Mapping
Advanced variations of the indicator track open levels across distinct trading sessions, allowing traders to see how the current price interacts with the Asian, London, and New York opens simultaneously.
Optimizing Your Trading System
While the Daily Open Indicator provides a powerful foundational map for the day, it is most effective when paired with complementary tools. Combining these horizontal session levels with Price Action patterns, average daily range (ADR) targets, or momentum oscillators allows you to filter out market noise during low-liquidity periods. Embracing this level-based approach ensures you trade alongside institutional flow rather than against it.
9 Downloads
Last Update:
May 19, 2026 15:43 PM
Published:
Jan 19, 2026 20:02 PM
Category: