The Day Candle Dashboard indicator is a practical and easy-to-use Forex tool designed for traders who want instant clarity about the current trading day. This free MT4 indicator visually highlights the current day’s candle across all timeframes, helping traders stay aligned with daily Market Structure. By using the Day Candle Dashboard indicator, traders can save time, reduce chart clutter, and make more informed trading decisions.
Whether you are a beginner or an experienced Forex trader, understanding where the current daily candle stands is essential. This indicator simplifies that process by presenting the information clearly and consistently on every chart.
Understanding the Day Candle Dashboard Indicator
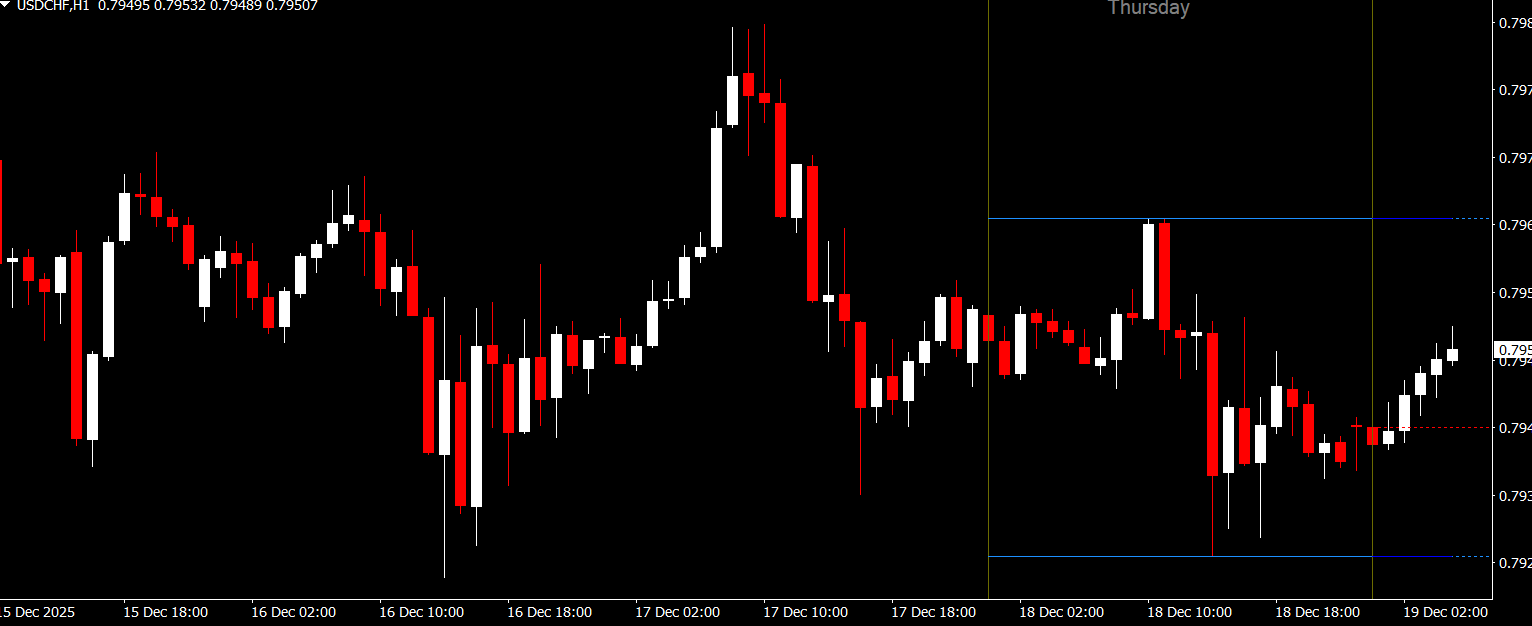
The Day Candle Dashboard indicator is built specifically for the MetaTrader 4 platform. Its primary function is to identify and highlight the current day’s candle on all timeframes. This means that whether you are analyzing M1, H1, or D1 charts, the indicator keeps you oriented within the same trading day.
The indicator draws a red vertical line on the chart to mark the beginning of the current day. In addition, it displays the current day’s candle details on a compact dashboard, using clear colors and sizing to make the information easy to read at a glance.
How the Indicator Works on MT4
Once installed on MT4, the Day Candle Dashboard indicator automatically detects the start of the current trading day based on broker time. It then:
Highlights the current day’s candle with a vertical red line
Displays day candle data on a small dashboard
Maintains visibility across all chart timeframes
This automatic functionality makes the indicator ideal for traders who frequently switch between timeframes while performing technical analysis.
Key Benefits for Forex Traders
Clear Market Orientation
One of the main advantages of the Day Candle Dashboard indicator is instant signal market orientation. Traders always know where the current day begins, which is especially helpful when analyzing intraday price action.
Time-Saving Analysis
Instead of manually identifying daily candle boundaries, traders can rely on the indicator to do it instantly. This saves time and reduces analytical errors.
Multi-Timeframe Compatibility
The indicator works seamlessly across all MT4 timeframes. This is particularly useful for traders who combine daily bias with lower-timeframe entries.
Beginner-Friendly Design
The dashboard-style display and simple visual cues make this indicator accessible even to new traders who are still learning market structure.
Who Should Use the Day Candle Dashboard Indicator
This indicator is suitable for:
Day traders monitoring intraday price movements
Swing traders aligning entries with daily structure
Scalpers who need daily context on lower timeframes
Forex beginners seeking visual clarity
Because it is completely free, it is a low-risk addition to any MT4 trading setup.
How to Use It in Your Trading Strategy
The Day Candle Dashboard indicator works best as a supporting tool rather than a standalone system. Traders often combine it with:
Trend indicators
Support And Resistance levels
Price action strategies
Session-based trading systems
By knowing exactly where the daily candle starts, traders can better judge momentum, breakout validity, and intraday reversals.
Why This Free Indicator Is Worth Using
Free Forex indicators often lack reliability or clarity, but the Day Candle Dashboard indicator stands out due to its simplicity and effectiveness. It does exactly what it promises without unnecessary complexity. For traders who value clean charts and fast information, this tool is a strong addition.
If you are looking to improve your MT4 trading experience with practical and free tools, visit IndicatorForest.com to explore more high-quality Forex indicators and resources designed for traders at all levels.
FAQ
1 Download
Published:
Dec 18, 2025 23:50 PM
Category: