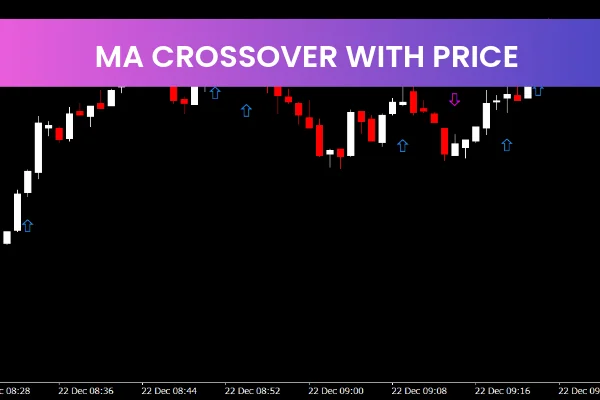
The 2 MA Crossover with Price Indicator MT4 is a useful and popular free Forex Indicator designed for the MetaTrader 4 platform. This indicator is widely used by traders who want a simple yet effective way to identify trend direction and potential trading opportunities using moving average crossover signals. By combining two moving averages with a price-based signal display, the 2 MA Crossover with Price Indicator MT4 provides clear and actionable market insights.
This indicator is ideal for beginner and intermediate traders, as it presents trend information in an easy-to-understand format without unnecessary complexity.
How the 2 MA Crossover with Price Indicator MT4 Works
The 2 MA Crossover with Price Indicator MT4 plots two moving averages directly on the chart. By default, it uses a 12-period moving average and a 26-period moving average, though these values can be customized based on individual trading preferences.
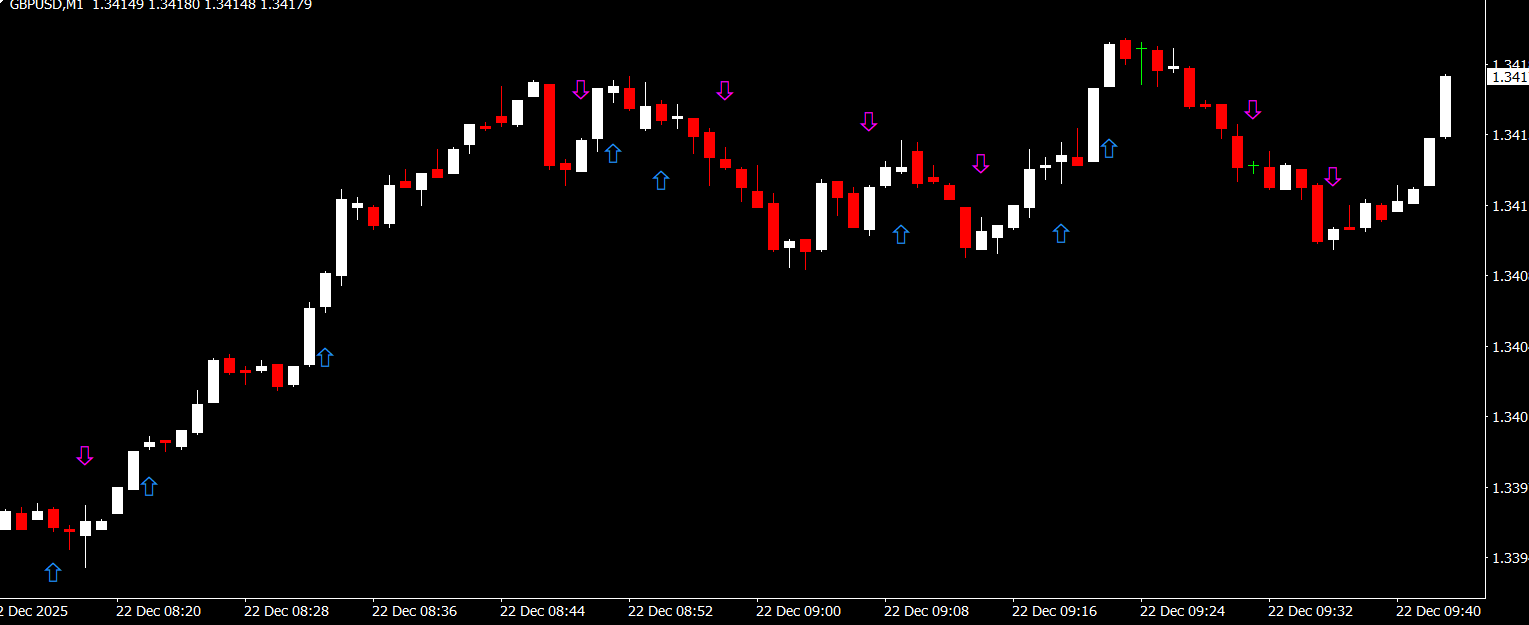
When the faster 12-period moving average crosses above the slower 26-period moving average, it signals a potential bullish trend. Conversely, when the faster moving average crosses below the slower moving average, it indicates a potential bearish trend. These crossover points are commonly used by traders to identify trend changes and trade entry opportunities.
In addition to the moving averages, the indicator displays a signal line that represents the difference between the two moving averages. This signal line moves above or below the zero level, providing an additional confirmation of crossover signals.
Understanding Crossover and Price Signals
The signal line crossing above the zero line suggests bullish momentum, while crossing below the zero line suggests bearish momentum. This feature allows traders to confirm moving average crossovers with momentum-based signals.
The indicator also shows the current price in a separate window, helping traders monitor price behavior relative to the moving averages. This combination improves timing and helps traders avoid entering trades too late.
Key Features and Benefits
Identifies bullish and bearish moving average crossovers
Displays current price in a separate window
Includes a signal line for crossover confirmation
Helps determine overall trend direction
Suitable for Scalping, day trading, and swing trading
Works on all Forex currency pairs
Compatible with all MT4 timeframes
Customizable moving average periods
Clean and simple visual layout
Free to download and use
Using the 2 MA Crossover with Price Indicator MT4 in Trading
To use the 2 MA Crossover with Price Indicator MT4, traders simply attach it to any chart on the MetaTrader 4 platform. Once applied, the indicator immediately plots the moving averages and signal line.
Traders often look for buy opportunities when the fast moving average crosses above the slow moving average and the signal line moves above zero. Sell opportunities are commonly identified when the fast moving average crosses below the slow moving average and the signal line moves below zero.
For better results, many traders combine this indicator with Support And Resistance analysis or higher timeframe trend confirmation. Proper risk management is also essential when trading crossover strategies.
Why Traders Choose the 2 MA Crossover with Price Indicator MT4
Traders prefer the 2 MA Crossover with Price Indicator MT4 because of its simplicity, reliability, and effectiveness. It removes guesswork from trend identification and provides clear signals that are easy to follow.
Being free, customizable, and suitable for multiple trading styles, this indicator remains a popular choice among Forex traders using the MT4 platform.
To download the 2 MA Crossover with Price Indicator MT4 and explore more professional Forex indicators, visit IndicatorForest.com and improve your trend trading strategy today.
FAQ
Published:
Dec 22, 2025 03:46 AM
Category: