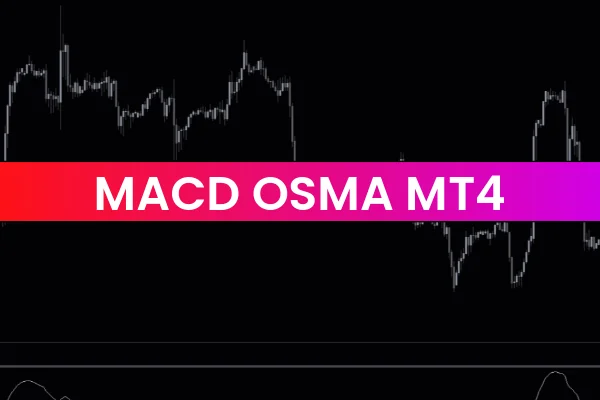
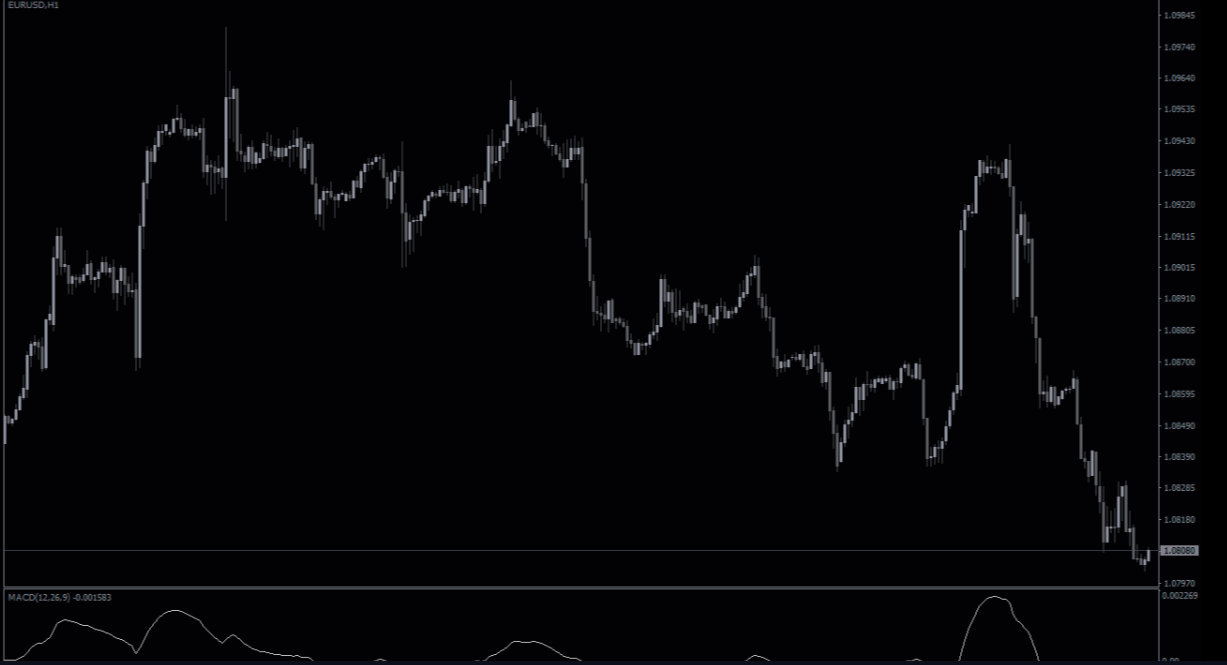
The MACD OSMA Indicator is a powerful and popular forex trading tool designed for the MetaTrader 4 (MT4) platform. This free indicator combines the MACD (Moving Average Convergence Divergence) and OSMA (Oscillator of Moving Average) indicators to provide traders with a comprehensive view of market trends and momentum. By calculating the difference between the MACD line and its signal line, the MACD OSMA Indicator MT4 helps identify potential buy and sell signals with higher accuracy.
Traders of all skill levels use this indicator to detect trend reversals, crossovers, and shifts in momentum, improving their decision-making in the forex market.
How the MACD OSMA Indicator Works
The indicator merges the functionalities of MACD and OSMA to provide a more complete market analysis.
MACD Component
Measures the difference between two exponential moving averages
Identifies trend direction and strength
Generates buy or sell signals when the MACD line crosses the signal line
OSMA Component
Calculates the difference between the MACD line and its signal line
Highlights momentum shifts and divergence
Helps detect potential trend reversals
By combining these two components, the MACD OSMA Indicator MT4 provides traders with clear signals for entry and exit points.
Key Features of MACD OSMA Indicator
Trend Reversal Detection
The indicator highlights possible trend reversals when crossovers occur or when divergence appears between price and indicator movements.
Momentum Analysis
By tracking OSMA values, traders can assess the strength of trends and identify potential weakening momentum before reversals.
Multi-Timeframe Compatibility
The indicator works on all MT4 timeframes, making it suitable for:
Day trading
Swing trading
Easy to Use
Traders can install the MACD OSMA Indicator MT4 quickly and interpret signals easily, whether they are beginners or advanced users.
How to Trade Using MACD OSMA Indicator
Crossover Strategy
Enter a buy trade when the MACD line crosses above the signal line and OSMA confirms upward momentum
Enter a sell trade when the MACD line crosses below the signal line with confirming OSMA signals
Divergence Strategy
Look for divergence between price and the indicator to anticipate trend reversals
Use additional tools like support/resistance or trend lines for confirmation
Risk Management
Always apply stop-loss and take-profit levels. While the MACD OSMA Indicator MT4 provides high-quality signals, disciplined risk management remains crucial.
Advantages of MACD OSMA Indicator
Free to download and use
Combines MACD and OSMA for comprehensive analysis
Detects trend reversals, crossovers, and momentum shifts
Suitable for all MT4 timeframes
Useful for traders of all experience levels
These advantages make it a reliable tool for enhancing forex trading strategies.
Who Should Use This Indicator
The MACD OSMA Indicator MT4 is ideal for:
Trend-following traders
Momentum and reversal traders
Beginners learning MACD strategies
Advanced traders seeking confirmation tools
Its versatility allows it to complement various trading approaches.
Final Thoughts
The MACD OSMA Indicator MT4 is a valuable forex tool that combines trend analysis and momentum tracking. By providing clear crossover and divergence signals, it helps traders make more informed trading decisions and increases the likelihood of successful trades.
👉 Visit IndicatorForest.com to download the MACD OSMA Indicator MT4 and explore more professional forex indicators to improve your trading strategy.
FAQ
MACD OSMA merges classic MACD with the Oscillator of Moving Average (OSMA), giving both trend and momentum information. It shows crossovers, histogram changes and divergences that can precede reversals.
A typical strategy is to buy when the MACD line crosses above the signal line with OSMA rising, and sell when it crosses below with OSMA falling. These combinations suggest that momentum is shifting in the direction of the crossover.
Divergence occurs when price makes new highs or lows but the indicator does not, warning that the trend may be weakening. Traders often watch for such patterns near strong support or resistance zones.
Yes, it can be used from very short intraday charts to long‑term weekly charts. Higher timeframes normally produce fewer but more meaningful signals.
Combine each signal with predefined stop‑loss, take‑profit and position‑sizing rules. Avoid entering immediately before major news events when volatility spikes can create whipsaws.
Published:
Dec 18, 2025 02:43 AM
Category: