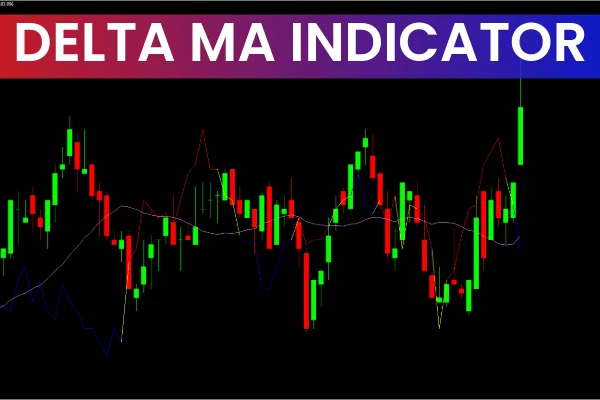
The Delta MA Indicator for MT4 is a highly effective technical analysis tool designed to detect subtle changes in market direction. Traders prefer this indicator because it is free to download, easy to apply across all timeframes, and suitable for forex, indices, commodities, and intraday or swing trading strategies.
Unlike traditional moving averages, the Delta MA Indicator provides a microscopic view of MA behavior, showing early signs of trend shifts before they appear on standard simple moving average (SMA) charts. This makes it valuable for traders who need an early warning signal during market reversals or periods of momentum loss.
How the Delta MA Indicator Works
At its core, the indicator uses the formula:
Moving Average (input1 – input2[d], n)
Here’s what it means:
input1 = user-defined price (default: Close)
input2[d] = price value d bars ago (default: Open)
Method = moving average type (default: SMA)
Period = length of the moving average (default: 10)
deltaRange = number of bars used for comparison (default: 5)
This formula calculates the difference between current price and past price over a controlled range. Because of this calculation, the Delta MA curve reveals minute changes in moving average slope, exposing early signs of momentum shifts.
Why This Matters
Traditional moving averages lag behind price because they smooth data.
Delta MA highlights changes in direction—not the direction itself—making it far more responsive.
This allows traders to:
Anticipate trend reversals
Identify weakening or strengthening momentum
Spot flattening MA curves before a trend change occurs
Characteristics of the Delta MA Indicator
As a lagging indicator, Delta MA relies on historical prices, making it unsuitable for predicting future prices. However, its unique structure allows traders to detect trend weakening earlier than with standard MA tools.
The indicator measures the difference between price and MA at two user-defined inputs across a selected bar range—known as Delta Range. This makes it especially useful for traders looking to confirm entries and exits with high precision.
How to Trade with the Delta MA Indicator for MT4
Understanding Zero-Line Signals
The zero line is the primary reference level.
Above 0 → Moving average is rising (bullish environment)
Below 0 → Moving average is falling (bearish environment)
When price rises above zero, the indicator shows upward-moving values, signaling potential buy opportunities. Conversely, when values fall below zero, the indicator shows that momentum is weakening, signaling potential sell or exit zones.
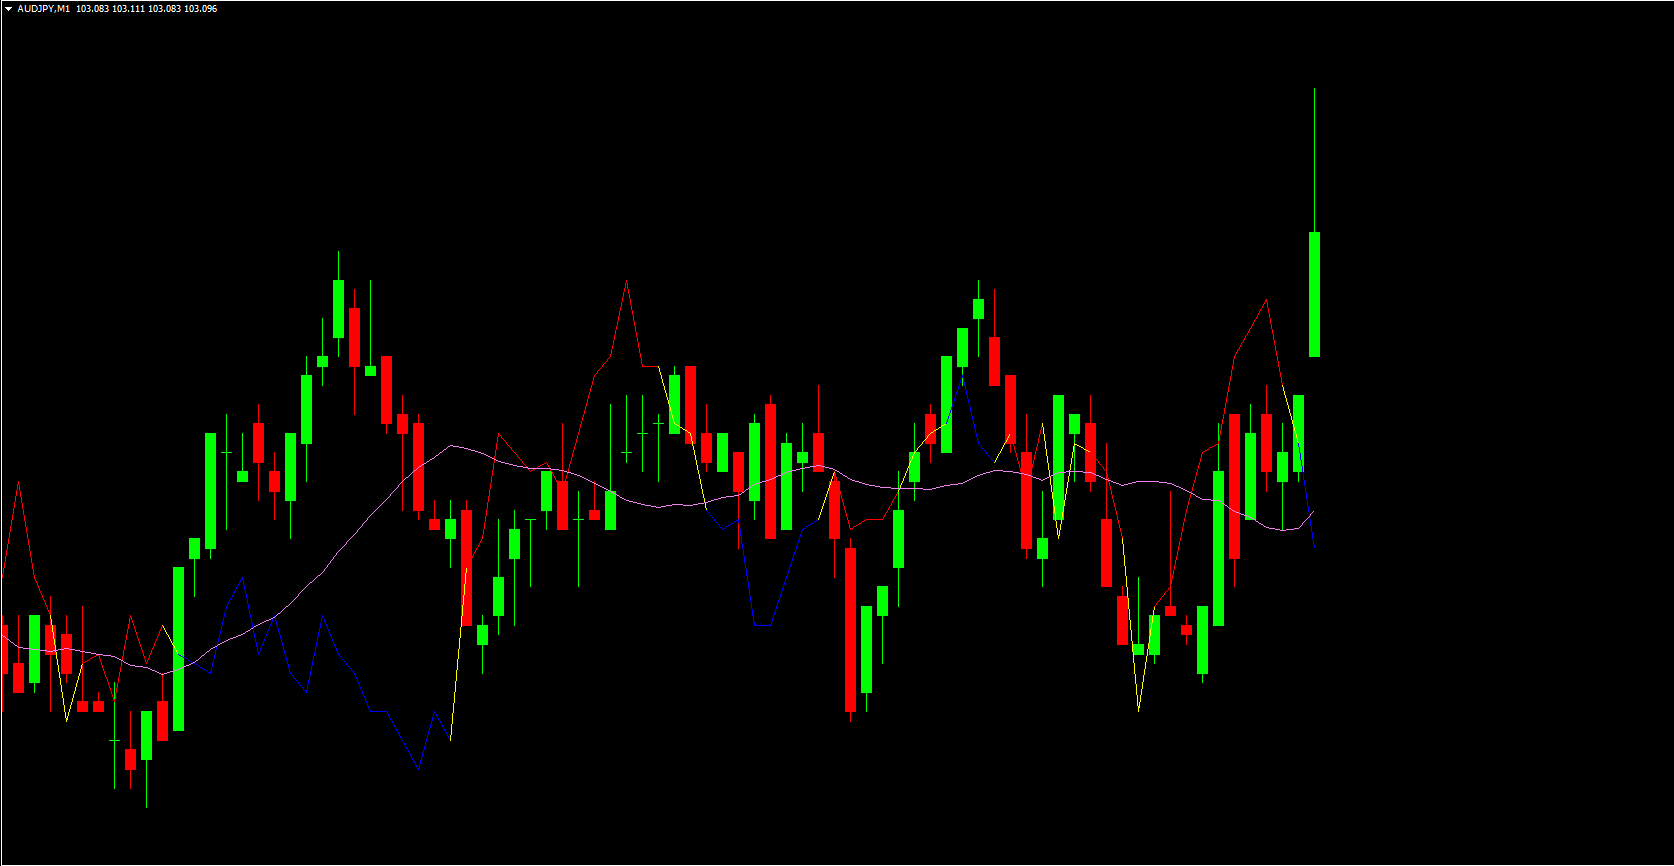
Example Using EURUSD (H1 Timeframe)
In the sample chart of EURUSD:
A reversal took place around April 26, 2022, moving from 1.052 → 1.054
The Delta MA line moved incrementally above zero, confirming the bullish reversal
As price climbed, the indicator’s slope strengthened, showing momentum alignment
When SMA turned bearish during pullbacks, the Delta MA also dropped below the zero line, confirming temporary down-swings.
Detecting Early Trend Flattening
Before a major Trend Reversal:
The Delta MA curve begins to flatten
Bars become shorter
Momentum begins decreasing
This behavior gives traders an early signal to prepare for market shifts—ideal for setting pending orders or tightening stop-loss levels.
Why Traders Prefer the Delta MA Indicator
Works on all timeframes
Free to download and easy to install
Compatible with most forex strategies and systems
Extremely useful when used in:
MA ribbons
Envelopes
Convergence–divergence strategies
Helps forecast trend changes earlier than standard moving averages
To maximize accuracy, it is recommended to combine the Delta MA with tools like RSI, MACD, or Price Action patterns.
Conclusion
The Delta MA Indicator for MT4 is one of the best tools for traders seeking early insight into market direction. Its ability to reflect subtle changes in moving average behavior makes it ideal for anticipating trend reversals and improving trade timing. While it should not be used alone for predictions, when paired with other indicators, it becomes a powerful addition to any trader’s strategy.
For more free, powerful trading tools, visit IndicatorForest.com.
FAQ
2 Downloads
Published:
Dec 06, 2025 09:59 AM
Category: