Master Objective Support and Resistance with the Demark Trend Lines Indicator
Drawing trendlines is one of the most fundamental skills in technical analysis, yet it remains highly subjective. Two traders looking at the exact same asset chart will often draw completely different lines, leading to conflicting trading biases and inconsistent entries. For day traders and scalpers managing fast-moving currency pairs like the EUR/USD, subjective charting errors can become incredibly expensive. The Demark Trend Lines indicator eliminates human bias from your workspace by calculating structural boundaries using strict, rule-based mathematical criteria.
What is the Demark Trend Lines Indicator?
The Demark Trend Lines indicator is an automated charting software built for trading platforms like MetaTrader. It is based entirely on the mechanical charting methodologies developed by legendary market pioneer Tom DeMark. Instead of arbitrary line placement, DeMark introduced a rigid, scientific way to identify true structural validation points, known as TD Points.
The indicator continuously scans recent Price Action to identify two specific types of structural nodes:
- TD Supply Points: Local price peaks surrounded by lower highs on both sides.
- TD Demand Points: Local price troughs bordered by higher lows on both sides.
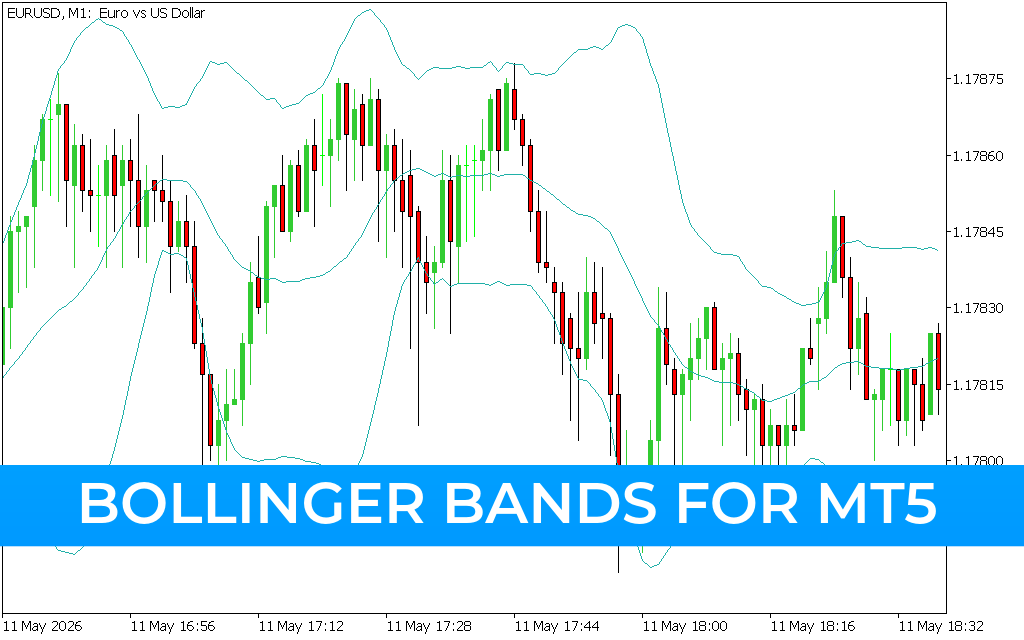
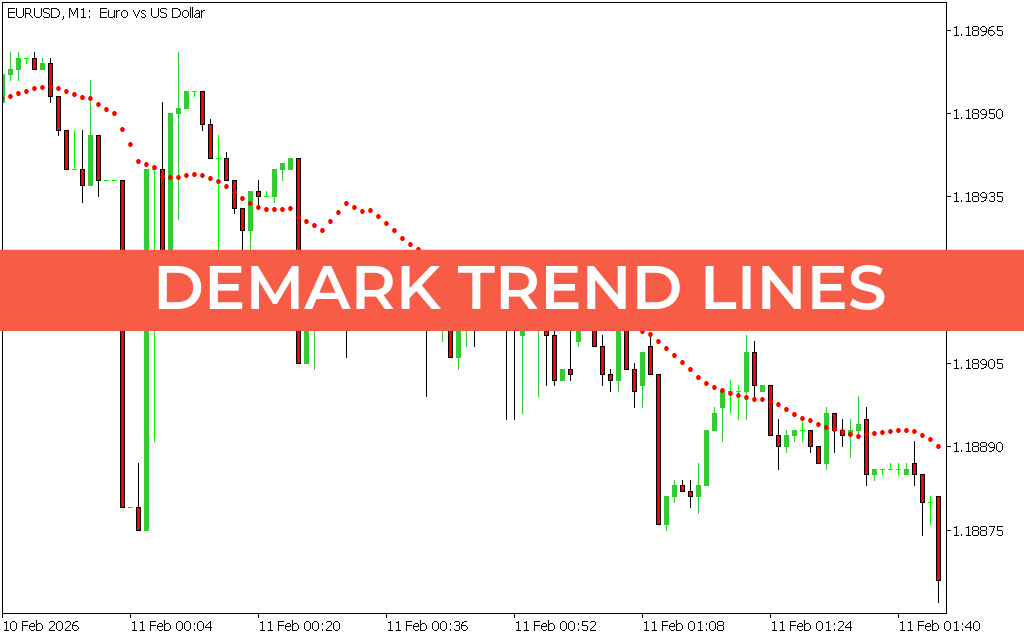
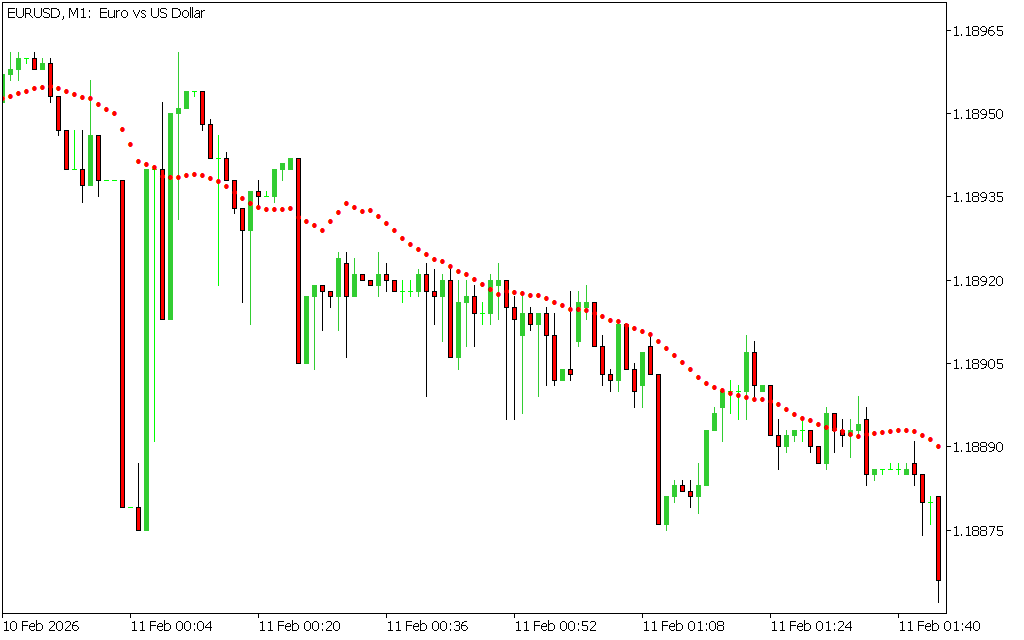
Once the indicator identifies the two most recent, statistically valid TD Points, it instantly projects an automated line across your screen. On rapid, high-frequency intervals like the 1-minute (M1) timeframe, it plots a continuous sequence of dynamic support or resistance nodes (displayed as precise red or green dots) to map out the immediate directional trend line.
Key Structural Features and Trading Benefits
- 100% Mechanical Execution: By automating line placement based on mathematical price relationships, it removes analytical guesswork and fear of missing out (FOMO).
- True Breakout Detection: DeMark trendlines are designed to anticipate when a true breakout is occurring versus a false trap, utilizing specific "TD Qualifiers" based on the close of preceding candles.
- Real-Time Dynamic Updates: As visible on liquid intraday charts, the indicator automatically recalculates and shifts its tracking boundaries as soon as a new structural high or low is printed, keeping your chart aligned with current institutional flow.
- Clean, Non-Lagging Interface: Unlike heavy moving averages that lag significantly behind price action, this indicator overlays neatly on your candlesticks, preserving your clean chart real estate for pattern identification.
How to Trade with Demark Trend Lines
Trading with this indicator centers on trading immediate price rejections or aggressive market breakouts.
- Trading Trend Line Breaks: Watch for an asset to consolidate heavily beneath an automated downward trend line. If a candlestick breaks above the line and closes decisively past the boundary, the bearish structure has fractured. Execute a buy order to ride the ensuing upward expansion.
- Trading Trend Line Rejections: In an established downward channel, wait for price action to pull back upward toward the dynamic line of dots. If a candle prints a long wick rejection or a bearish reversal pattern upon touching the line, it validates institutional defense. Execute a short entry with a protective stop-loss placed tightly above the line.
Bring institutional-grade consistency to your technical analysis by downloading the Demark Trend Lines indicator today.
1 Download
Last Update:
May 19, 2026 16:36 PM
Published:
Jan 19, 2026 14:01 PM
Category: