Master Trend Reversals with the DeMark Trend New Indicator
Identifying the exact moment a market trend exhausts itself and reverses is the holy grail for forex traders. While standard moving averages and trendlines lag, specialized tools like the DeMark Trend New indicator are engineered to anticipate these pivotal shifts. Based on the mechanical market timing principles developed by legendary analyst Tom DeMark, this MetaTrader indicator removes subjectivity from your charts, providing precise, data-driven entry and exit signals.
Understanding the Mechanics of DeMark Trend New
The DeMark Trend New indicator simplifies complex market structure by automatically plotting TD (DeMark) Trendlines and identifying critical exhaustion points. Unlike traditional trendlines that rely on a trader's visual bias, DeMark logic uses objective price relationships—specifically comparing the current bar’s highs and lows to previous sessions—to establish true Support And Resistance.
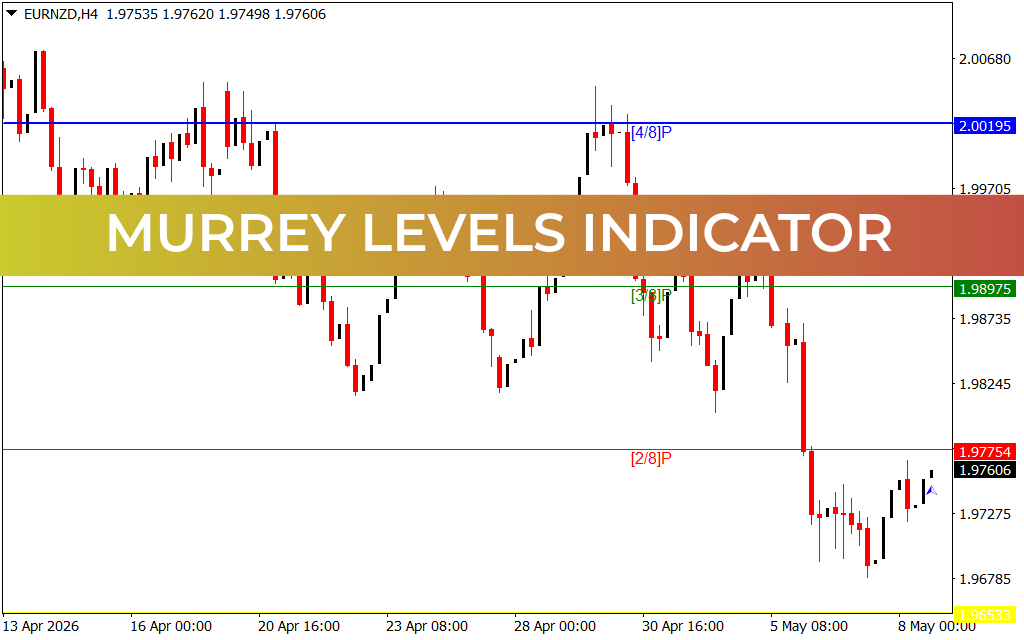
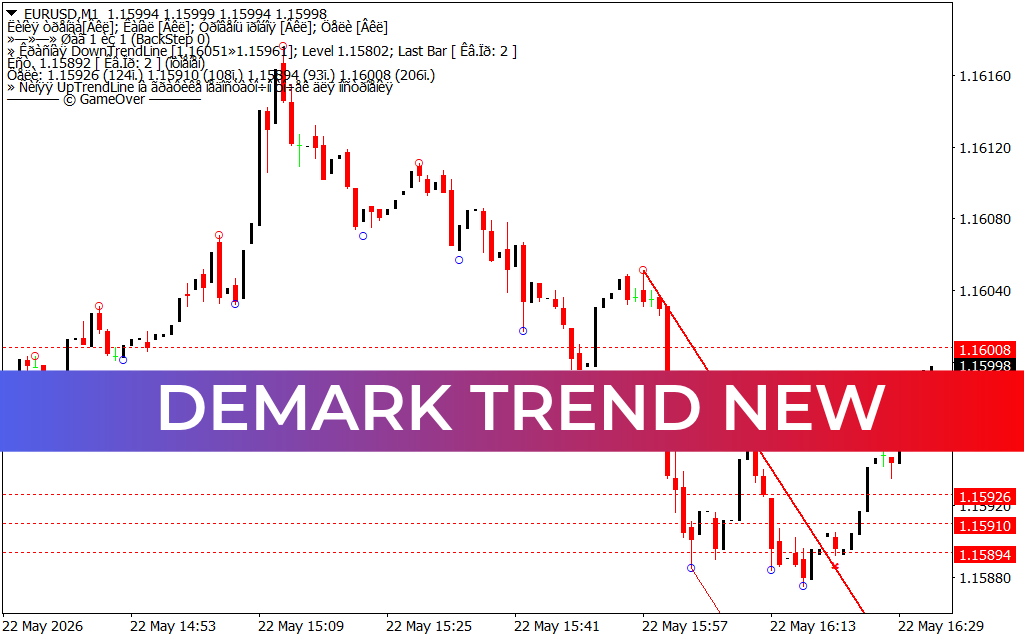
As seen on the EURUSD M1 chart, the indicator actively tracks algorithmic swing highs and lows, marking them with red and blue circles.
- Red Circles: Represent structural swing highs (resistance pivots).
- Blue Circles: Represent structural swing lows (support pivots).
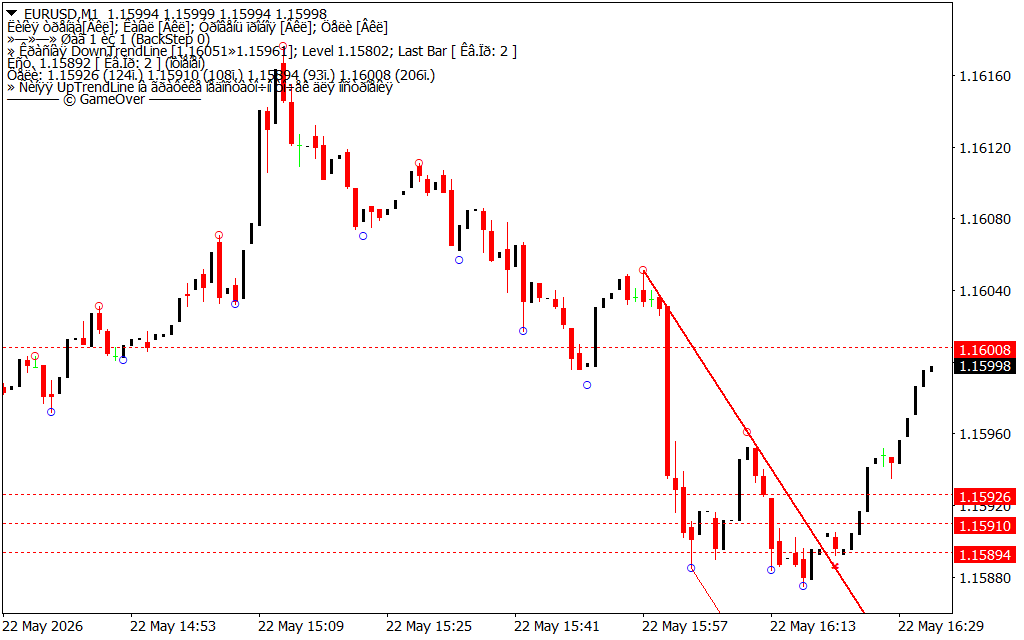
When a clear trend is established, the indicator projects an automated TD Trendline (the solid red diagonal line). A breakout above or below this line signals an impending, high-probability momentum shift, allowing scalp traders to capture early reversals before the broader market reacts.
Key Features and Trading Advantages
- Objective Trendline Analysis: Eliminates human error by automatically connecting the most statistically relevant swing points.
- Real-Time Pivot Detection: Visualizes key institutional levels using intuitive color-coded circles, simplifying multi-timeframe analysis.
- Built-in Support and Resistance Levels: Highlights key historical price magnets (indicated by the horizontal dashed red lines like 1.16008 and 1.15926) where price is likely to stall or bounce.
- Versatility Across Timeframes: Highly effective for M1 Scalping as well as higher-timeframe swing trading.
How to Trade with DeMark Trend New
To maximize win rates, traders should utilize the DeMark Trend New indicator as a confirmation tool within a broader trading strategy.
- The Breakout Setup: Wait for the indicator to draw a diagonal TD Trendline. A definitive candle close across this line indicates a structural breakout.
- Horizontal Confluence: Cross-reference the breakout with the indicator's automatically generated horizontal key levels. For instance, if price breaks a downward TD trendline just as it tests a major historical support level (e.g., 1.15894), the probability of a bullish reversal increases exponentially.
- Risk Management: Place stop-loss orders just beyond the most recent blue (support) or red (resistance) circle to protect your capital against false breakouts.
By removing the guesswork from trendline drawing, the DeMark Trend New indicator empowers retail traders to execute institutional-grade market timing with absolute discipline.
3 Downloads
Last Update:
May 22, 2026 19:34 PM
Published:
Jan 17, 2026 19:14 PM
Category: