Mastering Price Action with the DeMarker Mouteki Trend Indicator
In technical analysis, few tools match the power of clean geometric trendlines. However, drawing these lines manually introduces subjective bias—two traders looking at the exact same chart will often map completely different structures. The DeMarker Mouteki Trend Indicator solves this problem by automating market geometry. Combining the quantitative momentum analysis of Thomas DeMark (TD) with structural Mouteki trendline rules, this indicator supplies objective breakout signals, support/resistance baselines, and precise multi-target metrics.
The Synergy of DeMark and Mouteki Logic
The indicator uses a dual-layered architectural framework to evaluate the market. It eliminates guesswork by systematically identifying mechanical price points:
- Mouteki Demand and Supply Points: The system scans recent historical candlesticks to locate structural swing highs and swing lows based on specific bar-count parameters. A classic Mouteki pivot requires a swing point to be surrounded by bars with lower highs (for supply points) or higher lows (for demand points) on both its left and right sides.
- Thomas DeMark (TD) Points & Lines: The algorithm connects the two most recent valid structural extremums to form real-time, mathematical trendlines. When the market moves into a contraction or expansion phase, these lines adapt instantly to show the precise boundaries of the current trend.
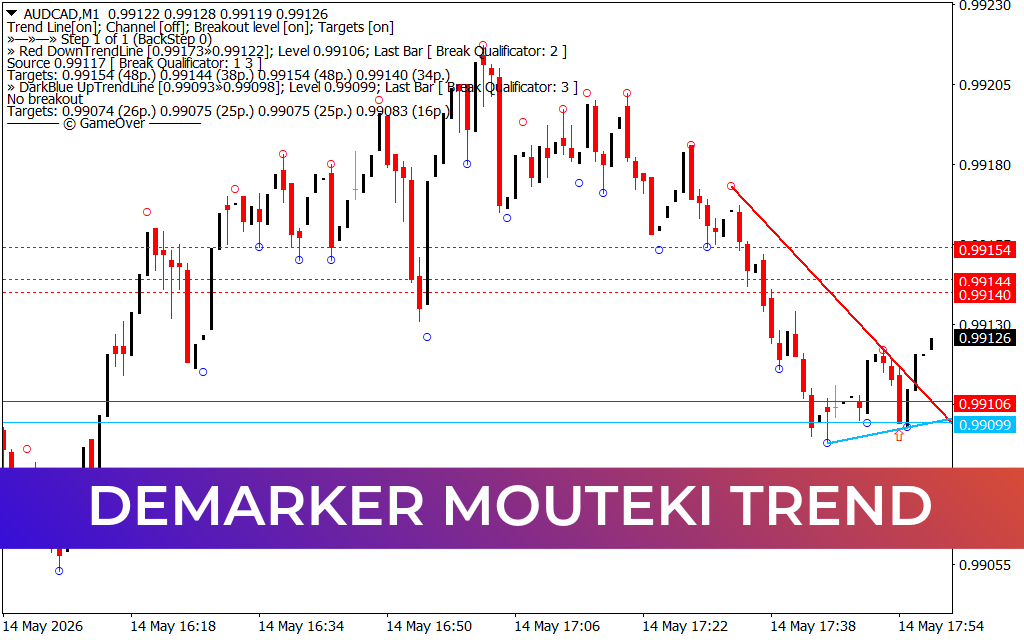
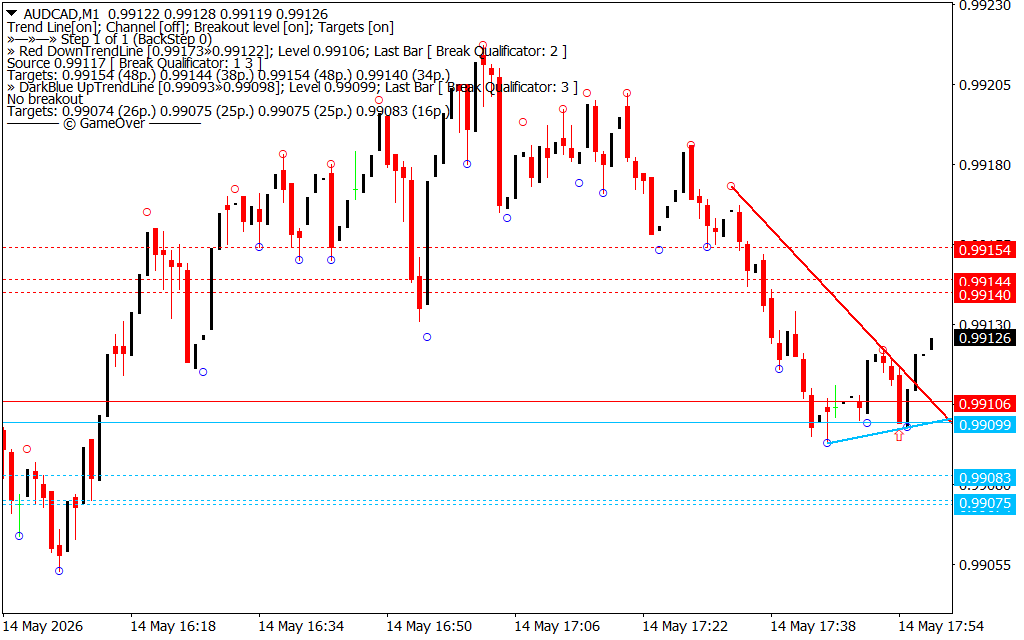
As displayed on the top-left information display of a chart, the indicator tracks whether trendlines and channels are active, flags the breakout level status, and calculates exact target points based on the velocity of the preceding market wave.
Trading Breakouts and Reversals Mechanically
The DeMarker Mouteki Trend system thrives during trend shifts, turning chaotic chart patterns into clear, step-by-step trading setups:
- Bullish Breakouts (Buy Signals): When Price Action breaks and closes above a valid, downward-sloping red supply trendline, the indicator registers a true breakout. This shift implies that buy side demand has overwhelmed structural market supply.
- Bearish Breakouts (Sell Signals): Conversely, when price action closes decisively underneath an upward-sloping dark blue demand trendline, a bearish expansion phase is confirmed.
- Target and Risk Metrics: Unlike lagging indicators that leave exit placement up to guesswork, this system automatically projects dotted target profit lines (e.g., Target 1, Target 2) on the chart. These goals are calculated using the vertical height of the price wave prior to the breakout, giving you clear, math-based objectives.
Precision Scalping on the 1-Minute (M1) Chart
While effective across all timeframes, the DeMarker Mouteki Trend Indicator is an exceptional asset for high-frequency scalping on the 1-minute (M1) chart. On micro-timeframes, false breaks occur frequently. By applying strict "Break Qualifiers" to ensure a candle has closed fully beyond the trendline rather than just spiking through it, the indicator protects scalpers from buying tops or selling bottoms during market noise.
4 Downloads
Last Update:
May 14, 2026 21:00 PM
Published:
Jan 22, 2026 01:28 AM
Category: