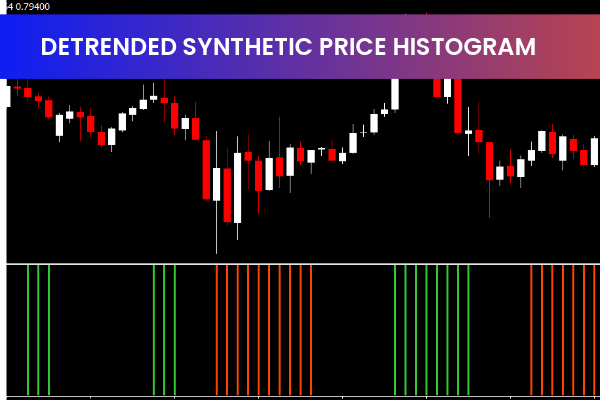
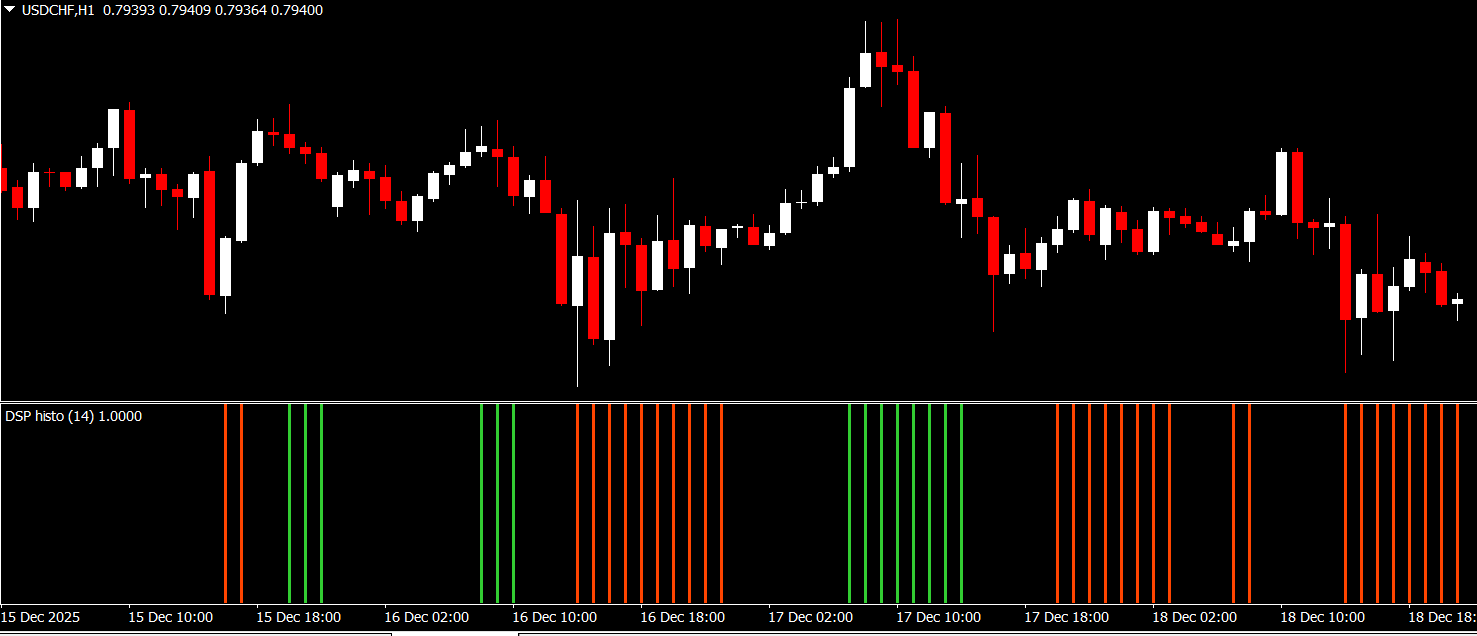
The Detrended Synthetic Price Histogram is a popular and effective free Forex Indicator developed for the MetaTrader 4 trading platform. It is designed to help traders identify market direction and momentum with greater clarity by removing short-term price noise. By combining raw price data with its moving average and then detrending the result, this indicator provides a clearer view of the underlying market trend
This indicator is especially useful for Forex traders who want a simple yet powerful way to analyze momentum shifts and Trend Strength without relying on overly complex tools.
Understanding the Detrended Synthetic Price Histogram
The Detrended Synthetic Price Histogram is a synthetic indicator, meaning it is derived from a mathematical combination of price and a moving average rather than raw price alone. The indicator creates a histogram-style display that visually represents the difference between price movement and its moving average.
Once this data is detrended, short-term fluctuations are reduced, allowing traders to focus on the broader trend structure. This makes it easier to distinguish between genuine momentum changes and temporary market noise.
How the indicator works
The indicator consists of two primary components displayed in a separate window. One line represents the price of the currency pair, while the second line represents the moving average applied to that price. The difference between these two values is plotted as a histogram.
When the histogram moves above the zero line, it typically signals bullish momentum. When it moves below the zero line, it indicates bearish momentum. The detrending process smooths the histogram, helping traders identify trend direction more reliably.
Identifying market trends
One of the main strengths of the Detrended Synthetic Price Histogram is trend identification. Sustained histogram movement above or below the zero level suggests a strong directional trend. Traders can use this information to trade in alignment with the dominant market direction.
This is particularly helpful in trending markets, where staying aligned with momentum can significantly improve trade consistency. The indicator helps traders avoid entering trades against the prevailing trend.
Analyzing market momentum
Momentum analysis is another key application of the Detrended Synthetic Price Histogram. The height and expansion of histogram bars reflect the strength of market momentum. Increasing histogram values suggest strengthening momentum, while decreasing values may signal slowing momentum.
When momentum begins to weaken, traders can prepare for potential consolidations or trend reversals. This makes the indicator useful not only for entries but also for managing existing trades.
Trend reversals and momentum shifts
Potential trend reversals can often be spotted when the histogram changes direction or crosses the zero line. A transition from negative to positive values may indicate a bullish reversal, while a shift from positive to negative may suggest a bearish reversal.
These signals are most effective when confirmed with additional tools such as Support And Resistance levels, candlestick patterns, or higher timeframe trend analysis.
Using the indicator for trade entries
Traders commonly use the Detrended Synthetic Price Histogram to confirm trade entries. For example, in an uptrend, buy entries may be considered when the histogram remains positive and momentum strengthens after a pullback.
In downtrends, sell entries may be favored when the histogram stays below zero and momentum resumes after temporary corrections. This approach helps traders avoid premature entries and improves timing.
Exit strategies and risk management
Exit decisions can also be enhanced using the indicator. When histogram momentum begins to fade or shows divergence against price movement, it may signal a good time to secure profits or tighten stop-loss levels.
By observing momentum changes early, traders can manage risk more effectively and avoid holding positions during unfavorable market conditions.
Ease of use and flexibility
The Detrended Synthetic Price Histogram is easy to install, configure, and interpret. Its simple visual design makes it accessible to beginners, while its analytical depth makes it valuable for experienced traders.
The indicator works well across different currency pairs and timeframes, making it suitable for Scalping, day trading, and swing trading strategies.
Why Forex traders use this indicator
Forex traders appreciate the Detrended Synthetic Price Histogram for its clarity and reliability. It removes much of the noise that often leads to false signals and helps traders focus on true market momentum.
Because it is free to use on MT4, it has become a popular choice among traders seeking effective momentum and trend analysis tools without added cost.
To explore more free MT4 indicators and professional Forex analysis tools, visit IndicatorForest.com and strengthen your trading strategy today.
Image Suggestions
detrended-synthetic-price-histogr
FAQ
1 Download
Published:
Dec 18, 2025 15:35 PM
Category: