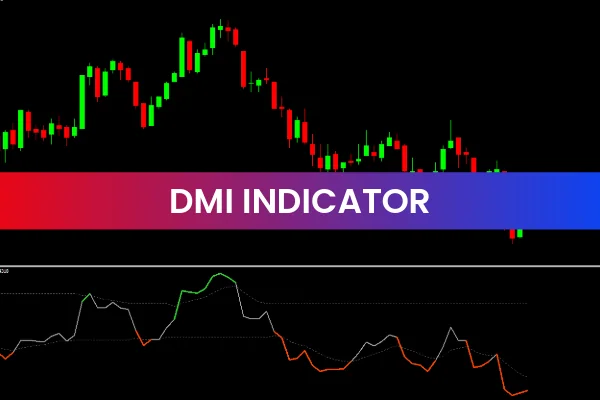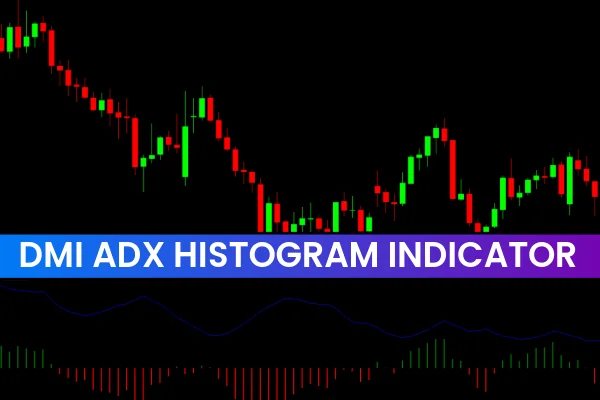
The DMI ADX Histogram Indicator for MT4 combines the Average Directional Index (ADX) and the Directional Movement Index (DMI) to provide traders with a complete view of market trends. While ADX measures Trend Strength, DMI indicates trend direction. Together, the DMI ADX Histogram offers BUY and SELL signals along with trend strength visualization, making it an essential tool for forex, stock, commodity, and index traders.
The indicator works on any timeframe, from short-term intraday charts to long-term swing setups, and suits both novice and advanced traders.
DMI ADX Histogram Trading Signals
The histogram replaces traditional D+ and D- lines and is calculated as the difference between D- and D+. Traders can combine the histogram with the ADX line to confirm trend strength and generate accurate trading signals.
Trend Signals
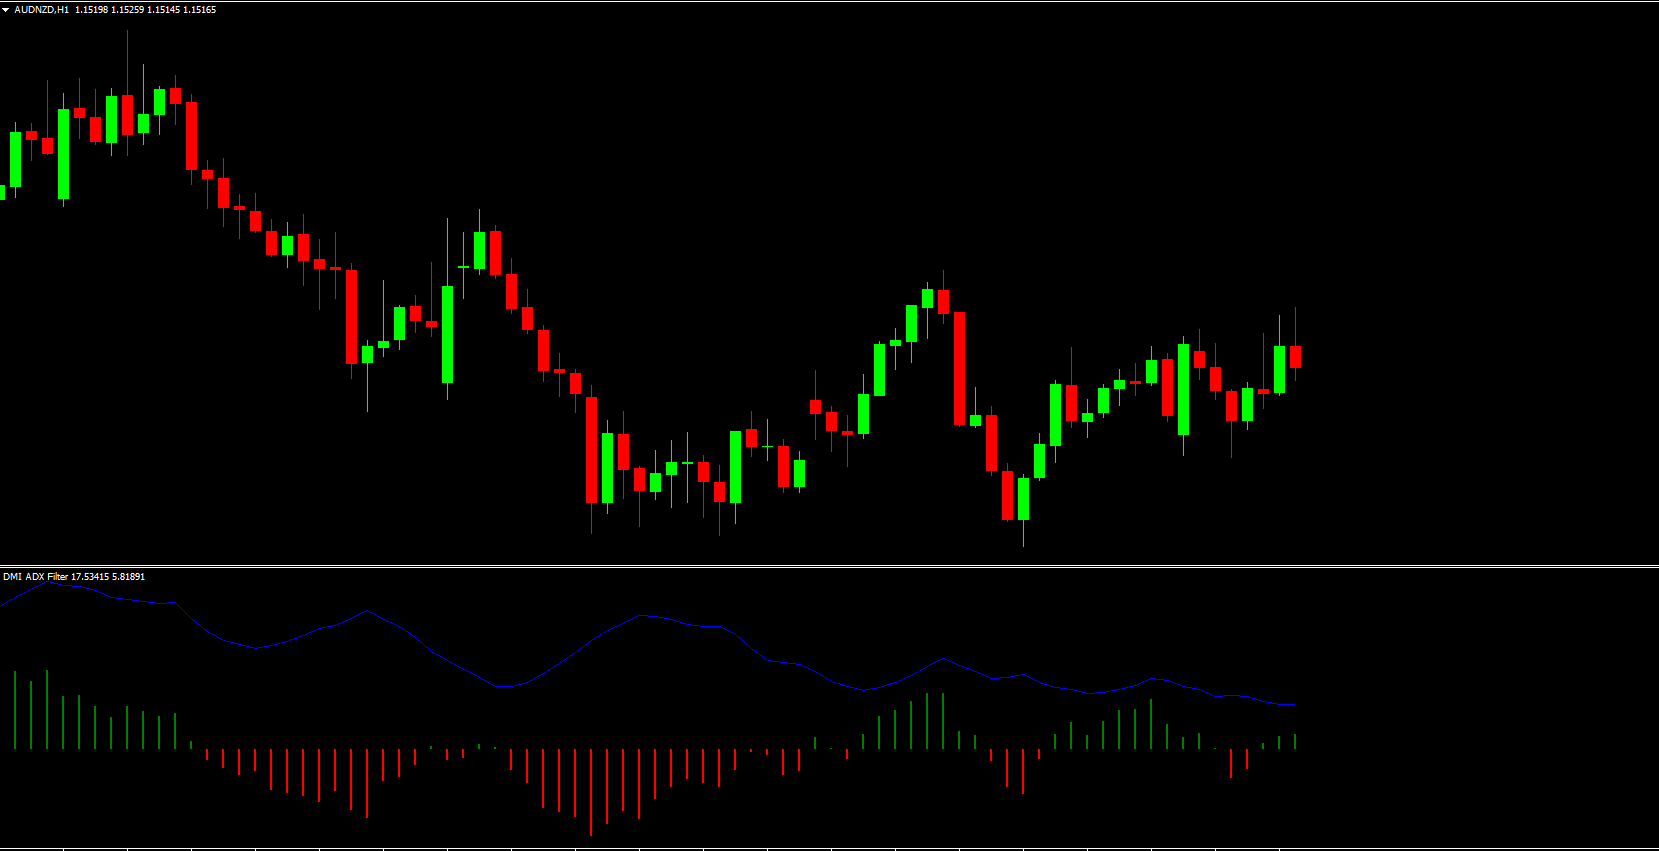
Green histogram bars – uptrend; BUY signals above zero
Red histogram bars – downtrend; SELL signals below zero
Traders can open positions as the histogram changes color and exits can be taken when the opposite signal appears. Confirming with the ADX line helps assess trend strength and identify early exit points.
Using Divergence
The DMI ADX Histogram also works as a leading indicator. Divergence between price and histogram signals trend weakness or potential reversals. This makes the indicator valuable for anticipating market moves before traditional trend confirmations occur.
How Traders Use the DMI ADX Histogram
Beginners: Easily visualize trend direction and strength for confident trade entries.
Advanced traders: Combine with other indicators to develop complex technical strategies.
Swing & intraday traders: Utilize multiple timeframes (MTF) to optimize BUY/SELL signals.
Divergence trading: Spot trend reversals early by monitoring differences between price and histogram.
Why DMI ADX Histogram is Valuable
Identifies trend direction and strength simultaneously
Provides BUY and SELL signals with histogram color changes
Works for forex, stocks, commodities, indices, and metals
Suitable for all timeframes and multiple trading strategies
Supports divergence-based early Trend Reversal detection
Conclusion
The DMI ADX Histogram Indicator for MT4 is an indispensable tool for traders who want to analyze trends efficiently. By combining ADX with DMI, traders can measure trend strength, direction, and reversals all in one indicator. Using divergence and multi-timeframe analysis enhances trading accuracy, making this indicator suitable for both novice and professional traders.
For more free MT4 and MT5 indicators, visit IndicatorForest.com.
FAQ
The DMI ADX Histogram Indicator combines the Directional Movement Index (DMI) and Average Directional Index (ADX) into a histogram format. DMI shows trend direction through +DI and -DI lines, while ADX measures trend strength. The histogram format makes it easier to interpret these components together, providing insights into both trend direction and strength.
When the histogram is positive and rising, it indicates bullish trend strength. When it's negative and falling, it suggests bearish trend strength. The height of the histogram bars reflects trend strength - taller bars indicate stronger trends. ADX values above 25 typically indicate strong trends, while values below 20 suggest weak or ranging markets.
Enter buy trades when the histogram is positive and rising with ADX above 25, indicating strong bullish trends. Enter sell trades when the histogram is negative and falling with ADX above 25, indicating strong bearish trends. Avoid trading when ADX is below 20, as this suggests weak or ranging markets.
The combination of DMI and ADX provides both trend direction and strength information in one indicator. The histogram format makes it easier to interpret these components together, helping traders identify not only which direction to trade but also whether the trend is strong enough to warrant trading.
The indicator works on all MT4 timeframes and currency pairs, making it suitable for scalping, intraday trading, and swing trading strategies. Many traders prefer using it on H1 and H4 charts where trend strength signals are clearer, though it can also be effective on shorter timeframes when combined with proper confirmation.
4 Downloads
Published:
Dec 14, 2025 01:00 AM
Category: