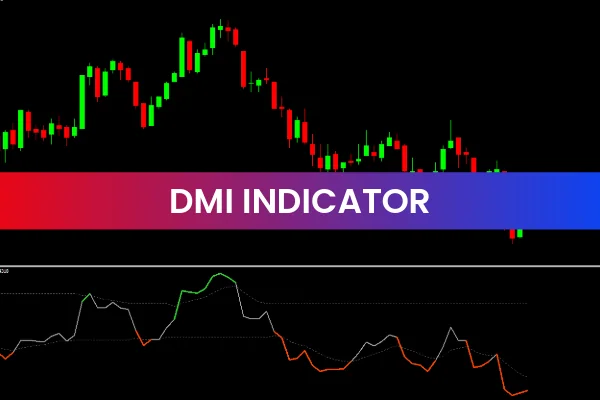
The Directional Movement Index (DMI) is a powerful technical analysis tool designed to help traders identify trend direction and strength, as well as potential entry and exit points.
The indicator consists of two primary lines:
+DI (Positive Directional Indicator): Measures the strength of upward price movement
–DI (Negative Directional Indicator): Measures the strength of downward price movement
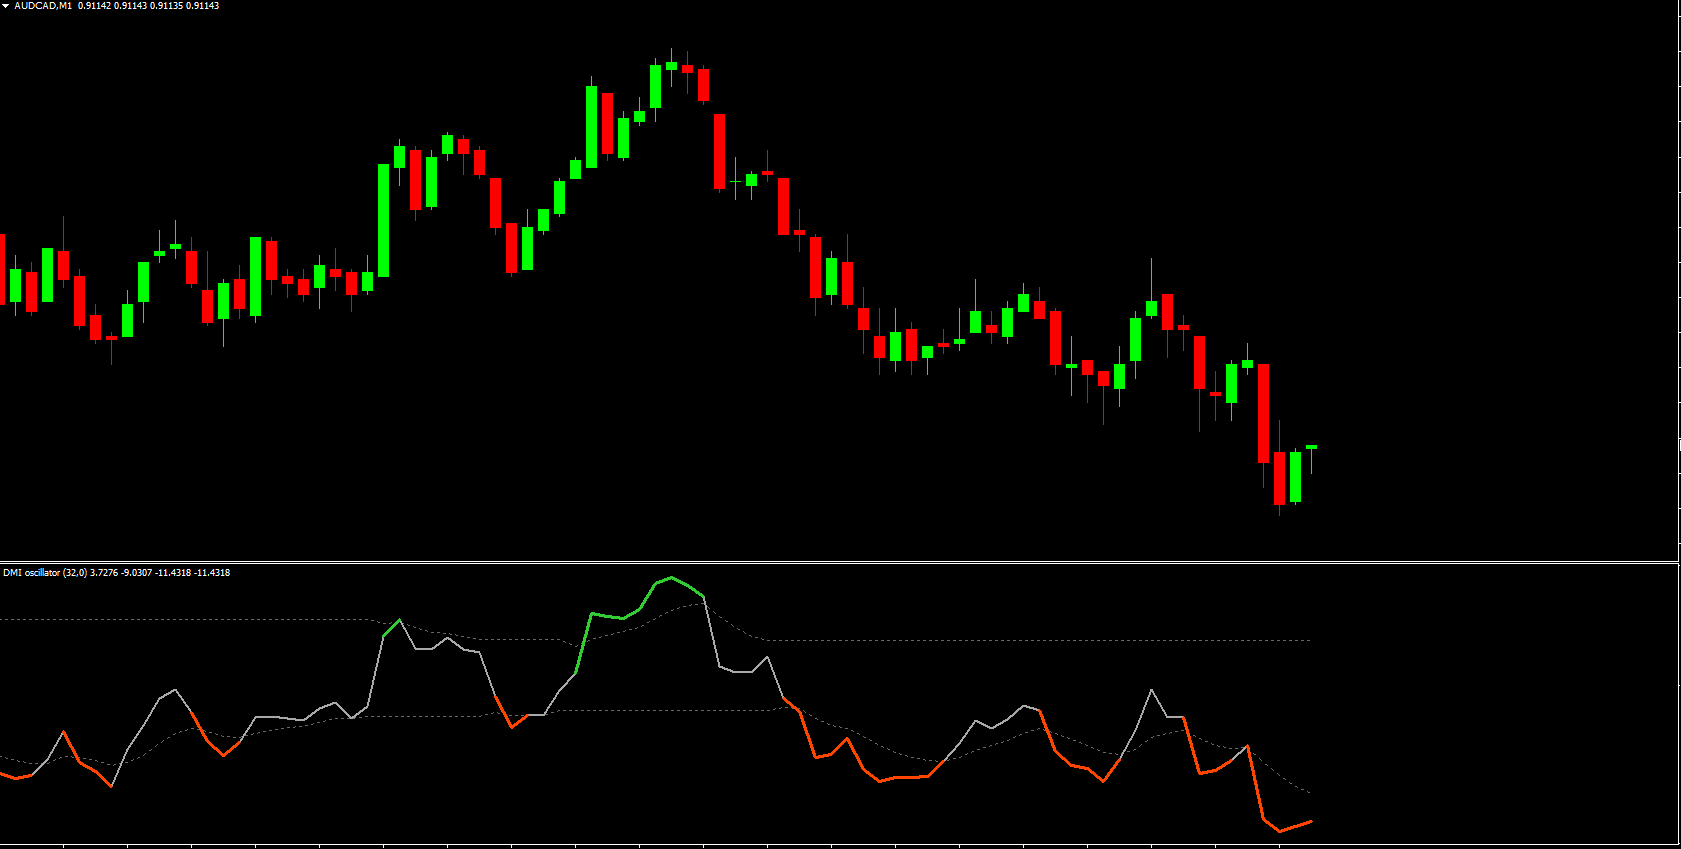
The DMI is calculated by comparing the difference between a currency pair’s high and low prices over a selected period. This allows traders to objectively assess whether buying or selling pressure is dominating the market.
How the DMI Indicator Can Benefit You
The DMI is especially useful for determining whether the market is bullish, bearish, or transitioning:
Bullish Trend: When the +DI line is above the –DI line, indicating strong upward momentum
Bearish Trend: When the –DI line is above the +DI line, signaling strong downward momentum
Additionally, the DMI helps traders identify potential trade entry and exit zones. When the +DI and –DI lines move close to each other, it suggests that the trend is losing strength or the market is entering a consolidation phase. This condition often precedes breakouts or trend reversals, making it an ideal time to prepare for new trade opportunities or manage existing positions.
Key Benefits at a Glance
Identifies trend direction and momentum
Helps confirm bullish and bearish market conditions
Assists in spotting weakening trends and consolidation zones
Useful for breakout, trend-following, and reversal strategies
Suitable for traders of all experience levels
FAQ
DMI (Directional Movement Index) measures trend strength and direction by comparing upward and downward price movements. It consists of +DI (positive directional indicator) and -DI (negative directional indicator) lines.
When +DI is above -DI, it indicates a bullish trend. When -DI is above +DI, it suggests a bearish trend. The ADX component measures trend strength, with higher values indicating stronger trends.
Buy when +DI crosses above -DI, sell when -DI crosses above +DI, use ADX to filter trades (only trade when ADX is rising), and combine DI crossovers with trend confirmation for stronger signals.
DMI provides clear trend direction signals, measures trend strength through ADX, works in various market conditions, and helps filter out weak trends to focus on strong, tradeable moves.
Combine with moving averages for trend confirmation, use with support/resistance levels for entry timing, integrate with momentum oscillators, and combine with price action patterns for stronger signals.
1 Download
Published:
Dec 17, 2025 09:48 AM
Category: