Conquer Trend Intensity: Ultimate Guide to the EMA Angle Indicator
In technical analysis, simple moving averages are excellent for identifying the general direction of a market. However, standard moving averages suffer from a critical flaw: they fail to quantify the immediate velocity or strength of a trend. A trader can easily see that price is above an Exponential Moving Average (EMA), but judging whether that trend is accelerating into a massive institutional expansion or stalling out into a dangerous consolidation zone is incredibly difficult using standard chart lines alone.
To capture the true momentum behind Price Action, professional market technicians look at the slope or angle of a moving average. The EMA Angle indicator automates this geometric mathematical process, turning standard trend tracking into a precise, quantifiable momentum engine.
What is the EMA Angle Indicator?
The EMA Angle indicator is an advanced mathematical oscillator designed to calculate and display the exact rate of change of a chosen Exponential Moving Average. Instead of forcing you to guess the steepness of a moving average line on your main price chart, this technical script calculates the exact trigonometric angle of the average's trajectory over a specific rolling window of candles.
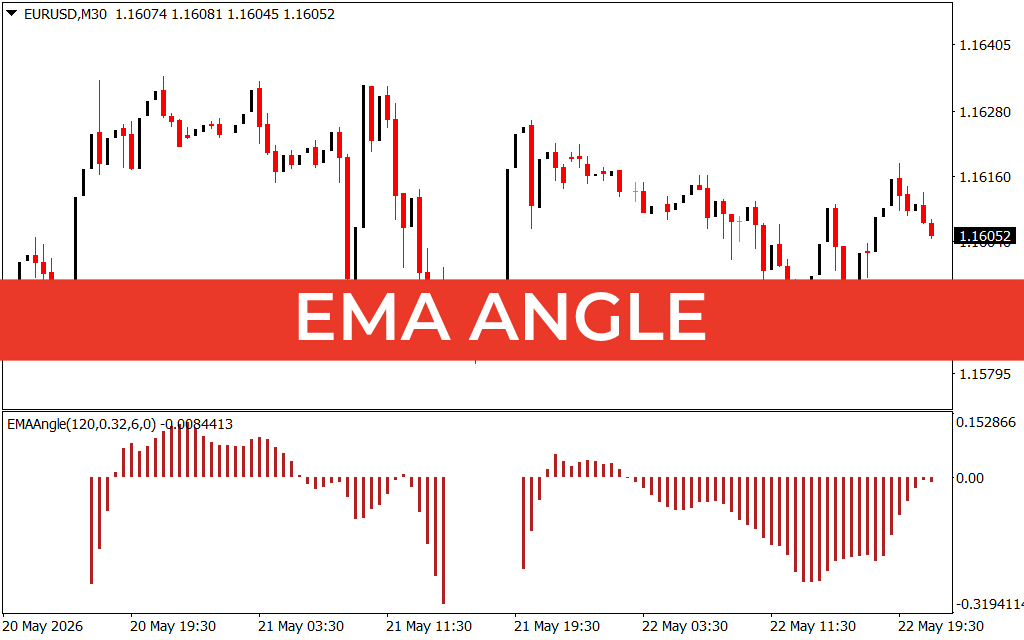
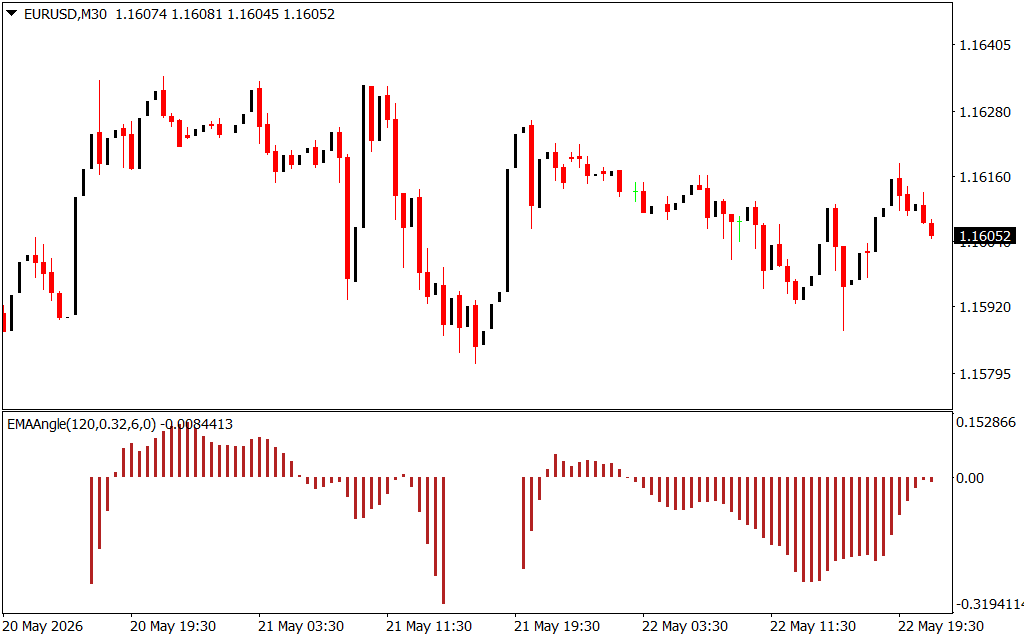
As demonstrated in the EUR/USD 30-minute (M30) chart above, the indicator operates in a separate sub-window beneath the candlesticks (EMAAngle(120,0.32,6,0)). Rather than rendering a confusing squiggly line, it translates the mathematical slope into a highly legible, dual-colored vertical histogram track that fluctuates dynamically above and below a central zero equilibrium baseline.
Key Features and Strategic Advantages
- Quantifiable Trend Slope: Measures the precise steepness of moving averages, allowing you to filter out flat, choppy markets mathematically.
- High-Contrast Histogram Layout: Uses distinct visual columns that map out the exact expansion and contraction cycles of institutional trend legs.
- Advanced Noise Reduction: Features custom smoothing parameters (such as a 0.32 threshold filter) to prevent fractional, low-volume price fluctuations from warping your trend bias.
- Universal Timeframe Scalability: Adapts seamlessly to any trading horizon, providing intraday scalpers and multi-day swing traders with identical structural clarity.
How to Trade with the EMA Angle Indicator
Integrating this high-precision slope oscillator into your mechanical execution routine simplifies your daily chart analysis into two core techniques:
- The Core Momentum Expansion: When the histogram bars break cleanly above the central zero equilibrium line and expand upward, it signals that the underlying EMA is tilting upward at an aggressive, highly efficient angle. This confirms a strong bullish expansion, giving you the green light to hunt for long entries. Conversely, when the bars drop firmly below zero, it confirms an accelerating bearish markdown phase.
- Trend Exhaustion and Divergence: When a trend is incredibly strong, the histogram bars will reach extreme vertical peaks. If price continues to make new highs or lows but the EMA Angle histogram peaks begin shrinking back toward the zero baseline, it reveals that the trend's angle is flattening out. This serves as an invaluable early warning system that the current trend is exhausting, prompting you to lock in profits or prepare for a sharp mean-reversion counter-move.
4 Downloads
Last Update:
May 24, 2026 03:03 AM
Published:
Jan 15, 2026 15:16 PM
Category: