Master Long-Term Market Waves with the JBR Trend Indicator
In financial trading, fighting the primary market trend is a primary cause of account drawdowns. While day trading lower timeframes offers quick excitement, the real institutional money is made by identifying and riding macro-level expansions over weeks or months. However, when analyzing long-term charts, temporary counter-trend retracements can easily fake out discretionary traders. The JBR Trend Indicator is an advanced technical utility built to solve this issue by filtering out multi-week market noise and highlighting the core underlying trend direction.
By deploying sophisticated calculation models directly onto your price canvas, this tool provides swing traders and long-term investors with absolute structural clarity.
The Power of High-Interval Trend Isolation
Relying on standard short-term indicators for macro analysis often leads to conflicting signals. The JBR Trend Indicator is optimized to process extensive mathematical sets of historical data, making it highly effective on higher-interval setups.
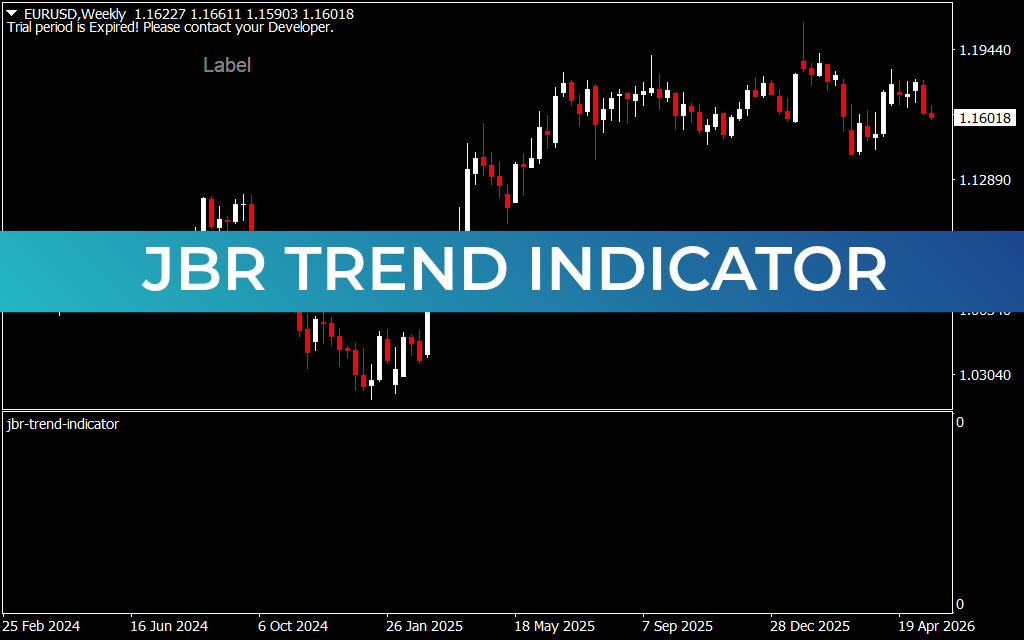
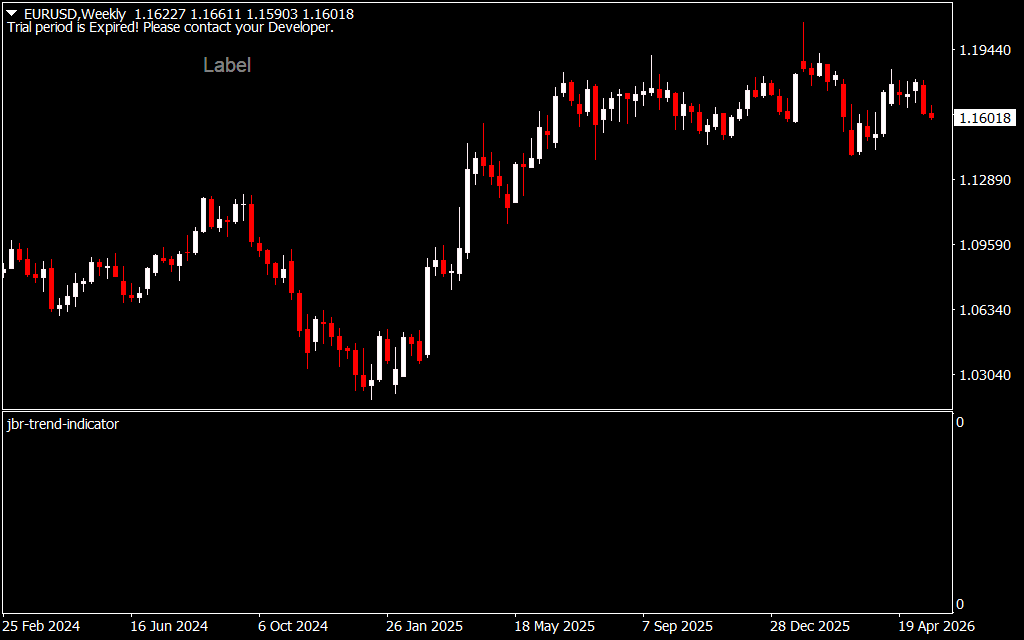
As demonstrated on the Weekly ($Weekly$) EUR/USD chart, the software transforms chaotic candlestick patterns into a unified directional framework:
- Clean Step-Line Geometry: Rather than cluttering your workspace with standard lag-heavy curves, the indicator plots a precise, step-like moving baseline. This geometric design provides an unshakeable Support And Resistance boundary that adjusts only when a true structural shift occurs.
- Institutional Directional Markers: To streamline entry execution, the script overlays bold, color-coded directional symbols directly over the trend line. Blue circular icons print continuously during dominant bull cycles, while red markers populate during bear phases, ensuring you always remain on the right side of the market.
- Macro Risk Management Guide: By tracing clear historical steps across large intervals, the indicator provides objective graphical points where a long-standing macro trend would mathematically be invalidated.
Executing Low-Risk Swing Strategies with JBR Trend
Integrating the mechanical visuals of the JBR Trend utility into your regular analysis creates a highly disciplined approach to long-term position management.
1. Trading the Macro Retracement (Trend Continuation)
During a powerful weekly bull market, Price Action will naturally experience multi-day downward pullbacks as institutions take profits. With the JBR Trend active, you can monitor these dips as they approach the step-line baseline. When the asset tests this dynamic floor and prints an exhaustion wick alongside continued blue indicator markers, it triggers a high-probability swing entry to rejoin the primary macro expansion.
2. Spotting Multi-Month Trend Reversals
A decisive structural shift occurs when a weekly candle breaks and closes entirely on the opposing side of the JBR step-line. This definitive cross warns the technical analyst that the prevailing multi-month trend has exhausted its volume. The sudden flip from blue to red markers gives you an incredibly early structural warning to exit long portfolios and hunt for major short positions.
Conclusion
The JBR Trend indicator is an essential addition to any MetaTrader terminal focused on swing trading or position investing. By replacing subjective charting line methods with automated, rule-based step metrics, it prevents emotional over-trading and keeps your portfolio aligned with institutional order flow. Download the JBR Trend indicator today to optimize your platform and dominate long-term market trends.
18 Downloads
Last Update:
May 20, 2026 02:12 AM
Published:
Jan 19, 2026 07:44 AM
Category: