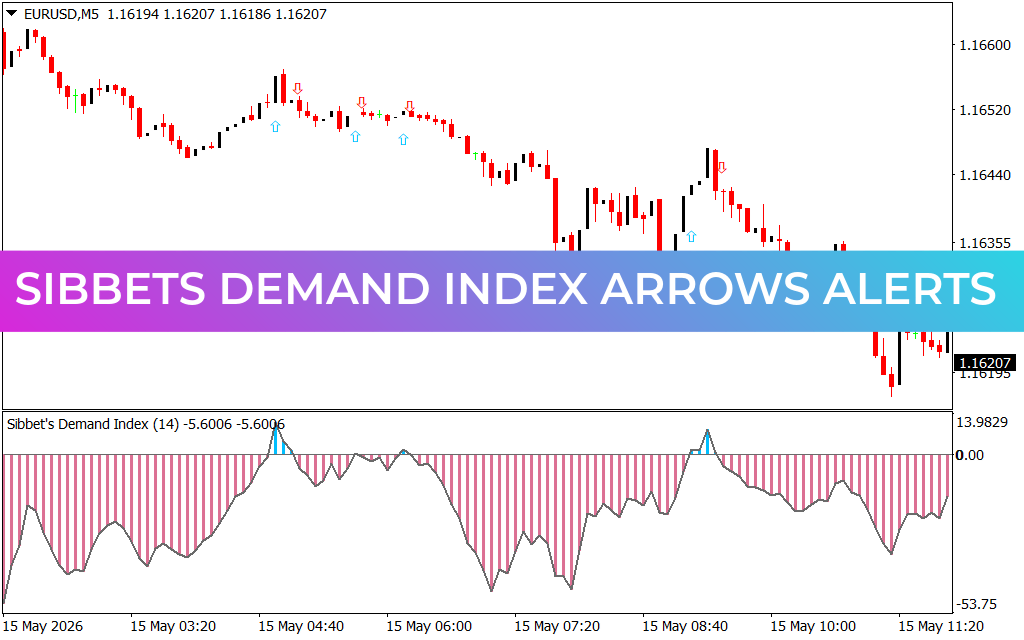
Trading with Institutional Volume: Sibbet's Demand Index Arrows Alerts
In the financial markets, Price Action alone can often paint an incomplete picture. A sharp upward movement might look like the start of a massive bullish trend, but if it occurs on thin, retail-driven volume, it is highly vulnerable to a sudden reversal. James Sibbet developed the Demand Index to solve this exact problem by combining price and volume into a single, leading technical oscillator. The Sibbets Demand Index Arrows Alerts indicator updates this legendary formula for today's high-frequency trading platforms, providing retail traders with automated on-chart entry signals the exact moment institutional volume flows back into the market.
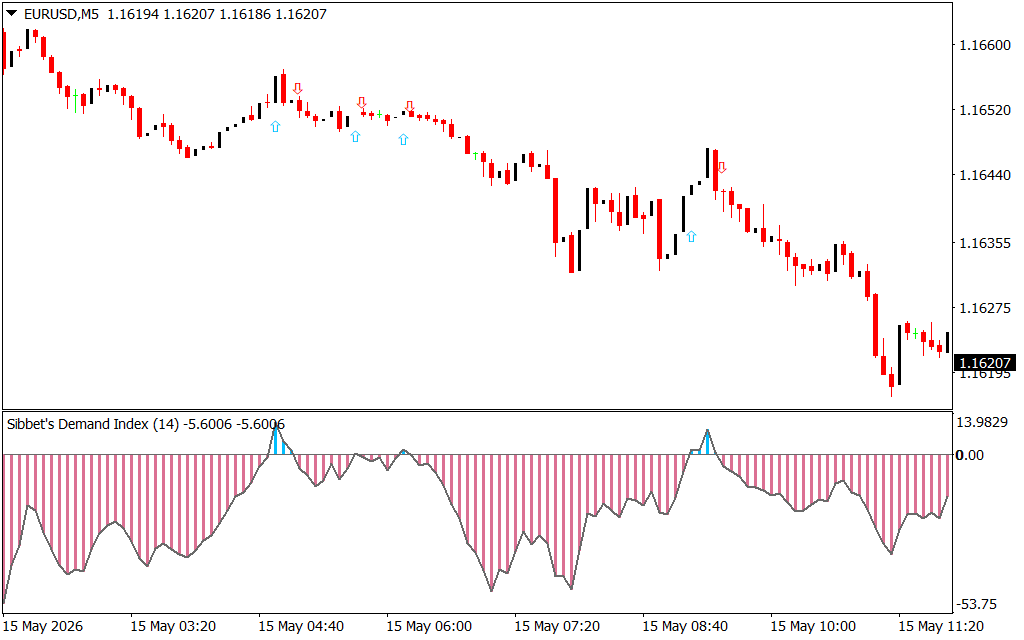
By tracking the ratio of buying pressure to selling pressure, this advanced technical indicator helps you isolate true institutional momentum from deceptive market noise.
Decoding the Core Mechanics: Volume and On-Chart Signals
The indicator functions through a beautifully synchronized dual-layered interface: a volume-weighted histogram located in a dedicated sub-window below your price screen, and intuitive entry arrows mapped directly onto your candlesticks. When loaded onto a liquid currency pair like the EUR/USD on a 5-minute (M5) chart, it provides clear, rule-based execution filters:
- The Bullish Institutional Accumulation Zone: When buying pressure vastly overpowers selling pressure, the Demand Index line climbs above the 0.00 threshold, accompanied by bright blue or green volume spikes. Concurrently, a hollow or solid upward-pointing arrow prints directly beneath the price candles. This serves as an immediate visual confirmation to hunt for high-probability long positions.
- The Bearish Institutional Liquidation Zone: Conversely, when institutional supply floods the market, the oscillator drops below the zero line, printing dark pink or red vertical bars. An on-chart downward arrow appears above the candlestick wicks, signaling that big money is driving the move lower and warning you to look exclusively for short entries.
- The Divergence Exhaustion Trap: One of the most powerful features of Sibbet's formula is its ability to spot volume divergences. If price action attempts to make a new low but the indicator histogram prints a shallow bottom, it unmasks institutional absorption. This setup gives scalpers an early warning to prepare for a explosive counter-trend rally.
Meticulously Optimized for Short-Term Scalping Systems
The Sibbets Demand Index Arrows Alerts utility is an invaluable edge for fast-paced trading styles like 5-minute Scalping and rapid breakout trading. It strips away the lag associated with traditional moving averages by evaluating raw transaction volume alongside real-time price delivery.
Instead of guessing whether a breakdown past a key support level is authentic, you check your dashboard. A clear down-arrow backed by heavy negative volume in the histogram gives you the definitive mathematical validation required to enter the market with confidence. By incorporating this institutional volume tool into your MetaTrader setup, you protect your trading account from sudden whipsaws and ensure your entries are perfectly aligned with real market liquidity.
1 Download
Last Update:
May 17, 2026 16:35 PM
Published:
Jan 20, 2026 16:41 PM
Category: