Master Multi-Timeframe Momentum with the Multi Period RSI Indicator for MT4
In the fast-paced world of technical analysis, the Relative Strength Index (RSI) has long been a foundational tool for identifying overbought and oversold market conditions. However, a significant limitation of the traditional RSI is its single-timeframe focus, which can lead to "tunnel vision" where a trader misses the broader trend context. The Multi Period RSI indicator for MetaTrader 4 (MT4) solves this problem by integrating momentum data from multiple timeframes or periods into a single, unified view, providing a comprehensive "big picture" of market strength.
The Power of Fractional Momentum
The Multi Period RSI functions by calculating the RSI values for various timeframes—such as M15, H1, H4, and Daily—and projecting them onto your current active chart. This allows traders to see at a glance whether the current intraday momentum is aligned with or diverging from the long-term trend.
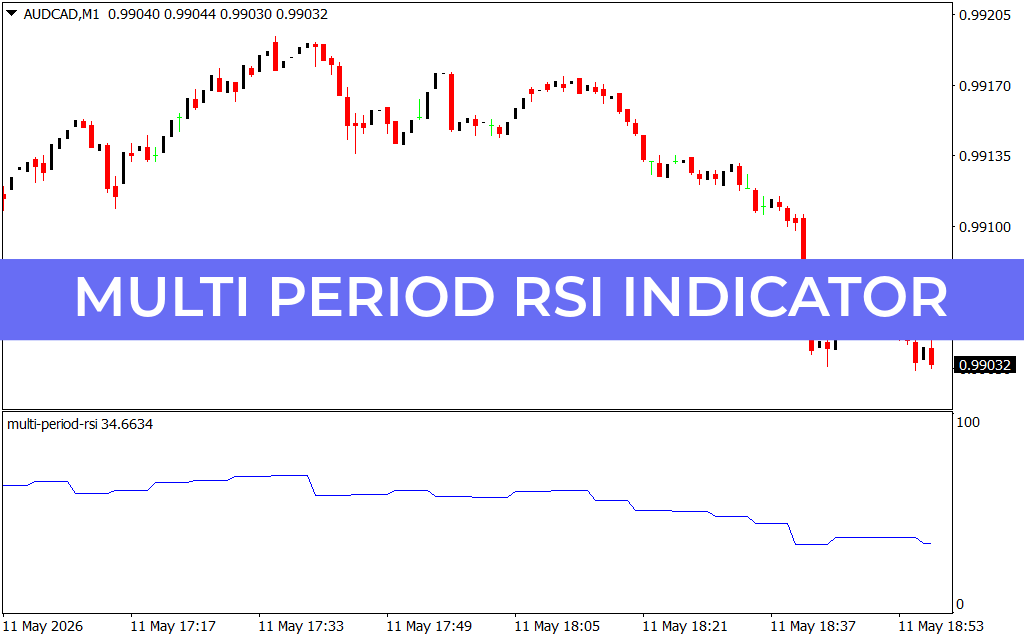
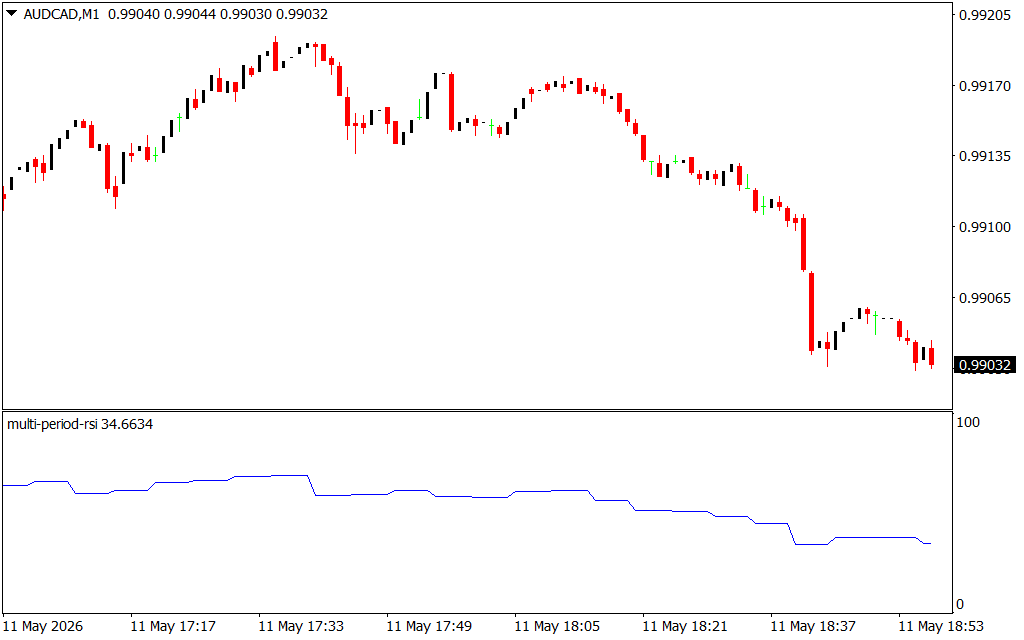
As shown in the AUD/CAD M1 chart, the indicator appears in a sub-window as a stepped blue line. Unlike a standard RSI that oscillates rapidly on a 1-minute chart, the Multi Period RSI provides a much smoother, hierarchical view of momentum. When the line is trending downward, as seen in the latter half of the session, it confirms that momentum across multiple periods has shifted to the bearish side, even if individual 1-minute candles show brief upward pullbacks.
Key Features and Strategic Advantages
- Unified Momentum Dashboard: Instead of toggling between four different charts to check momentum, you can view the consensus of multiple timeframes in one window.
- Trend Confluence Identification: The highest-probability trades occur when momentum across all timeframes aligns. If the Multi Period RSI is rising from the 30 level across H1 and H4, a long entry on the M15 timeframe has significant "weight" behind it.
- Advanced Divergence Detection: This tool is elite for spotting multi-timeframe divergence. If the price on your current chart makes a new high but the Multi Period RSI fails to reach a new peak, it signals that the broader market momentum is not supporting the current Price Action, warning of an impending reversal.
- Clear Overbought/Oversold Zones: The indicator retains the classic 0–100 scale, with the 70 and 30 levels serving as critical inflection points. In the provided example, the indicator tracks a steady decline from the overbought region toward the 30 level, signaling a sustained bearish move.
Strategic Implementation for Professional Traders
For scalpers and day traders, the Multi Period RSI acts as a "trend filter." If the higher-period RSI values are above 50, you only look for buy setups on the lower timeframes. This ensures you are never trading against the "current" of the larger market. For swing traders, it provides a precise tool for timing entries, allowing you to enter a long-term trend exactly when the short-term momentum aligns with the major direction.
By removing the noise of single-period oscillations, the Multi Period RSI provides the structural clarity needed to trade with confidence. It is more than just an oscillator; it is a multi-dimensional momentum engine that gives you a professional edge in any market condition.
1 Download
Last Update:
May 11, 2026 21:59 PM
Published:
Jan 24, 2026 13:08 PM
Category: