Simplifying Momentum: Trading with the Composite RSI 2 Histo
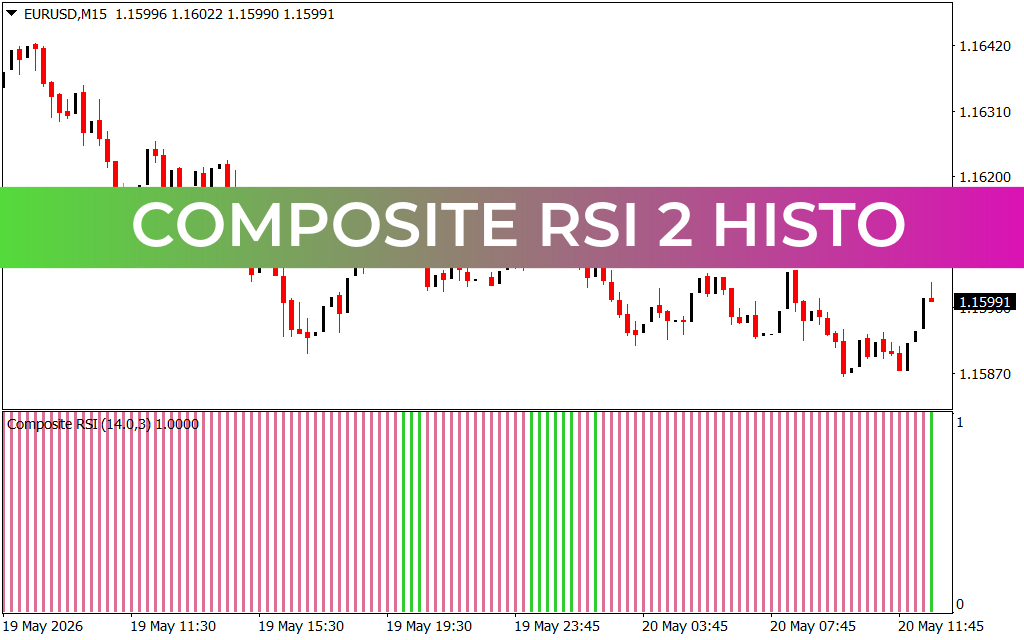
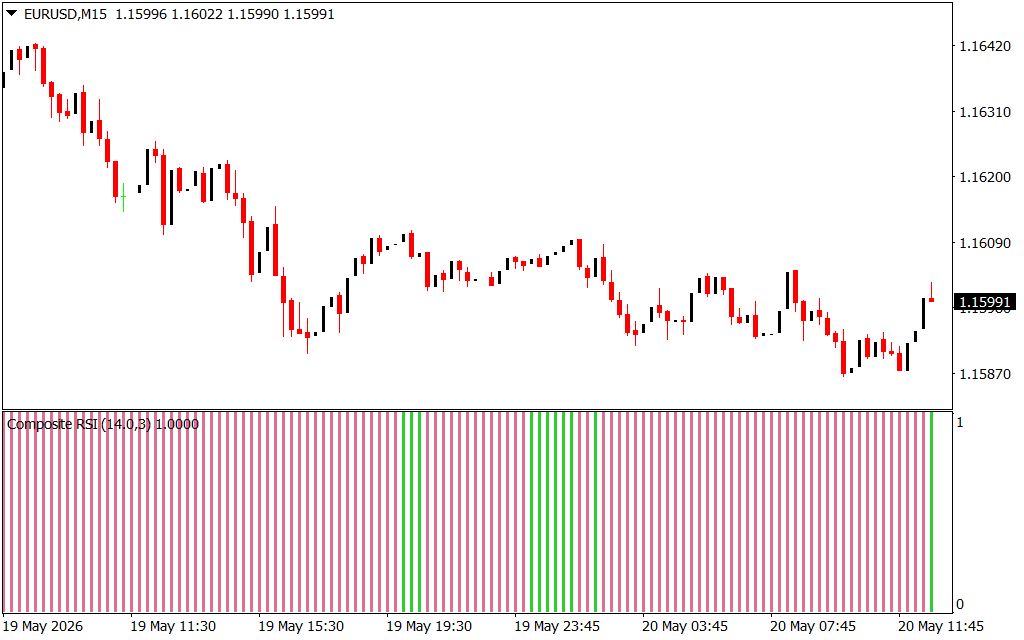
Relying on traditional lagging indicators in the fast-paced Forex market can lead to late entries and costly drawdowns. Standard oscillators often clutter price charts, requiring traders to constantly cross-reference multiple lines, levels, and crossover points. On this 15-minute (M15) EUR/USD chart, we see a distinct structural breakdown transitioning from an aggressive markdown phase on May 19th into a choppy, tight consolidation range by May 20th.
Identifying structural shifts within these lower-timeframe ranges requires clean, instantaneous momentum verification. For day traders and scalpers, filtering out low-probability false breakouts and catching immediate intraday reversals is where consistency is built. This is exactly where the clear visual style of the Composite RSI 2 Histo indicator transforms your data analysis.
Unlocking Dual-Timeframe Momentum with Visual Bars
The Composite RSI 2 Histo is an advanced technical script engineered to strip away chart clutter and convert complex relative strength mathematics into clean, vertical tracking bars. By mathematically combining two separate Relative Strength Index (RSI) periods, the indicator filters out raw market noise while keeping its high level of responsiveness to underlying price delivery.
When analyzing the EUR/USD Market Structure, this histogram framework provides instant trend consensus:
- Dominant Bearish Trend Confirmation: Throughout the sustained downward expansion on May 19th, the indicator prints consistent red vertical bars. This uniform coloring signals that both the short-term and medium-term RSI cycles are completely aligned on the sell side, warning retail traders never to catch a falling knife by buying early.
- Spotting Overextended Liquidity Sweeps: As the asset reaches a structural low near the 1.15870 pool on May 20th, notice the crisp green vertical bar that flashes at the absolute bottom of the swing. This immediate shift highlights a powerful bullish momentum response right as sellers fail to sustain the breakdown, flagging a high-probability zone for a quick intraday reversal or a long Scalping entry.
By translating complex trend and divergence equations into a straightforward binary color system, the utility ensures you remain strictly aligned with high-volume institutional flow.
Upgrading Your Technical Strategy
Attempting to track multiple oscillating lines across changing timeframes introduces cognitive fatigue and execution lag. Utilizing a streamlined dashboard indicator directly on your main platform workspace standardizes your execution rules and removes emotional bias from your trade management. The customizable alert framework allows you to receive instant push alerts the exact moment momentum shifts color, freeing up screen space so you can focus entirely on managing your risk. Integrating this professional-grade script into your MetaTrader infrastructure sharpens your entry precision, protects your equity from false breakout traps, and gives you a definitive statistical edge.
1 Download
Last Update:
May 20, 2026 15:51 PM
Published:
Jan 18, 2026 19:11 PM
Category: