The Elliott Wave Oscillator is a popular MT4 indicator based on the well-known Elliott Wave Theory by Ralph Nelson Elliott. According to this theory, market prices move in repetitive wave patterns that reveal the underlying direction and strength of a trend. The Elliott Wave Oscillator (EWO) helps traders identify these waves clearly, making it easier to detect impulsive waves, corrective phases, and potential reversal zones. Whether you trade forex, indices, stocks, or commodities, this oscillator works efficiently on all financial instruments.
Although the Elliott Wave Oscillator can be used on short-term charts, it performs best on medium to long-term timeframes where wave structures are more stable. This indicator is especially helpful for traders who follow trend analysis and want to optimize their entries using momentum behavior.
What Is the Elliott Wave Oscillator?
The Elliott Wave Oscillator is built from the difference between two moving averages. It displays histogram bars that help traders visualize wave strength. When the histogram expands, momentum increases. When it contracts, market momentum weakens—often signaling the end of a wave cycle.
The oscillator simplifies Elliott Wave theory by clearly showing the phases where waves are strongest or losing energy.
How to Use the Elliott Wave Oscillator
Understanding the Five-Wave Pattern
According to Elliott Wave Theory, the market price forms five waves:
Wave 1, 3, and 5 → Move in the direction of the trend (impulsive waves)
Wave 2 and 4 → Move against the trend (corrective waves)
The oscillator becomes especially useful in identifying Waves 3 and 5.
Identifying Wave 3 – The Strongest Momentum Point
Wave 3 is typically the strongest and longest wave.
The Elliott Wave Oscillator shows its largest histogram bar during this wave.
This confirms the trend direction and gives traders confidence to enter trades.
Detecting Wave 5 – Divergence Signal
When Wave 5 forms, the price often touches new highs in an uptrend (or new lows in a downtrend).
However, the oscillator typically forms a lower high (bullish divergence) or higher low (bearish divergence).
This divergence usually signals:
weakening trend
end of wave structure
a potential reversal
This makes the EWO extremely valuable for spotting turning points before they happen.
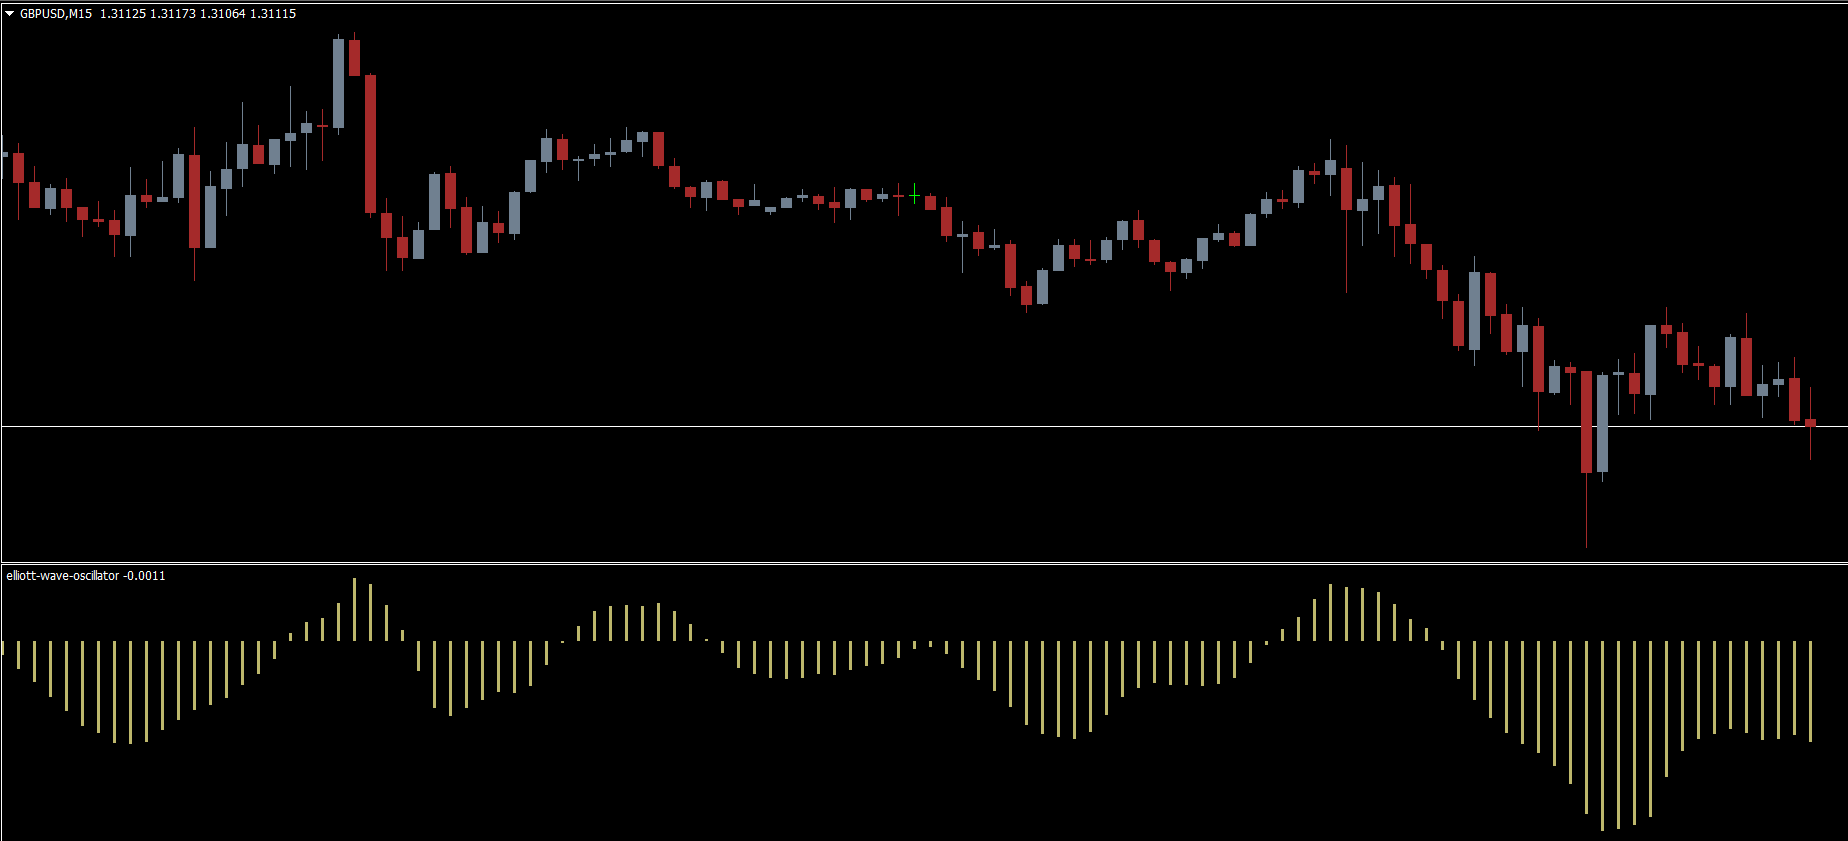
Trading Example with Elliott Wave Oscillator
Consider the Australian Dollar/Canadian Dollar (AUD/CAD) chart:
The oscillator prints its deepest low when the third wave forms and the price hits a new low.
The price forms an even lower low during wave five, but the oscillator forms a higher low instead.
This divergence signals that the Elliott wave pattern is ending and a trend reversal is likely.
This type of setup is considered highly reliable among Elliott Wave traders.
Why Use the Elliott Wave Oscillator?
Helps identify impulsive and corrective waves
Confirms trend direction and momentum
Detects divergence before reversals
Works on nearly all markets and timeframes
Ideal for Elliott Wave traders and trend followers
Best Practices
To improve accuracy:
Use medium-term charts (H1, H4, Daily)
Combine with Support & Resistance, MACD, or RSI
Avoid choppy low-volatility markets
Conclusion
The Elliott Wave Oscillator is an excellent MT4 indicator for identifying Elliott wave patterns, spotting the strongest impulsive waves, and detecting trend reversals through divergence. Whether you're a beginner or an advanced wave trader, this tool makes Elliott Wave analysis far easier and more precise.
For more free indicators and trading tools, visit IndicatorForest.com today.
FAQ
1 Download
Published:
Nov 19, 2025 09:32 AM
Category: