Mastering Market Cycles with the Slow KD Indicator
In modern technical analysis, momentum oscillators are vital tools for identifying overextended market conditions and catching major trend pivots. However, many fast-paced oscillators suffer from a common structural flaw: market noise. A traditional, fast Stochastic oscillator often generates a high volume of erratic crossovers during tight consolidations, trapping retail traders in premature positions. The Slow KD indicator provides a highly reliable solution for MetaTrader users by introducing a secondary smoothing layer to classic momentum math, delivering pristine reversal signals.
The Evolution of Stochastic Smoothing
To understand why the Slow KD indicator excels at tracking price turning points, it helps to break down the differences between traditional momentum indicators and smoothed technical models:
- Fast Stochastic (%K): Measures the current closing price relative to a defined high-low range over a set period. While highly sensitive, it reacts to every minor intraday tick.
- Slow Stochastic (%D): Applies an internal moving average filter directly to the raw calculations. This process mathematically dampens sudden price spikes and filters out market static.
By utilizing the SlowKD(5,3,3) mathematical configuration, the indicator shifts your focus away from random market noise and toward valid, cyclical waves. For day traders and scalpers operating on highly liquid assets like EURUSD, this mathematical filter prevents overtrading and helps ensure entries align with true institutional volume shifts.
Navigating the Sub-Window Oscillator Grid
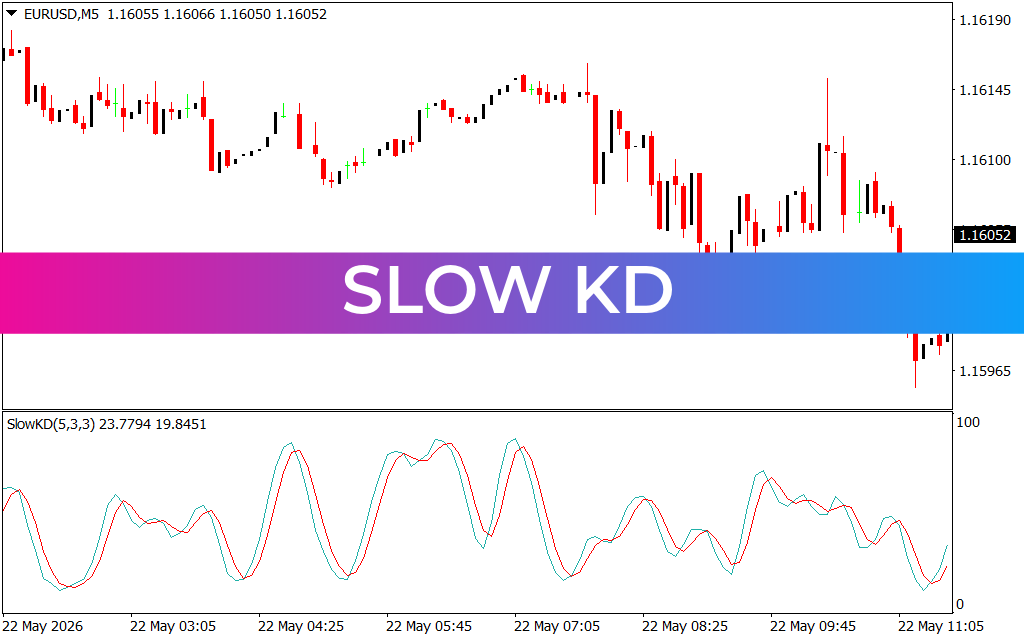
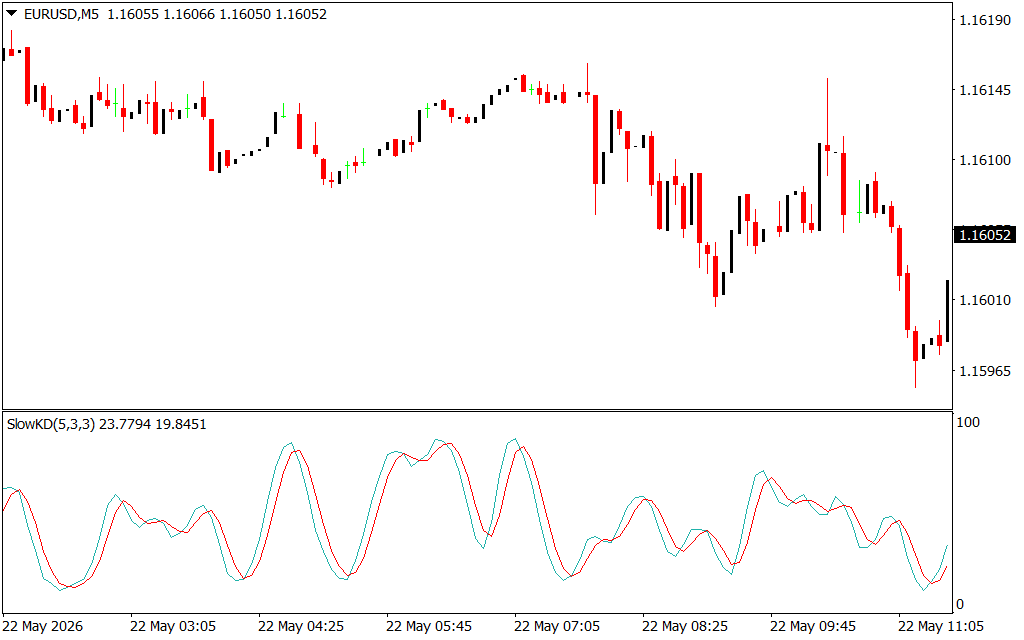
As demonstrated on the EURUSD 5-minute (M5) chart, the Slow KD indicator completely leaves your main price window clean. It arranges its real-time data calculations into an organized sub-window pane below the Price Action, tracking market velocity across a standard $0$ to $100$ scale:
- The Light Blue Line: Represents the responsive tracking line, charting sudden momentum surges as price develops.
- The Solid Red Line: Acts as the smoothed signal line, establishing the steady, dominant baseline for trend direction.
The most potent trade opportunities occur when these lines enter extreme valuation bands. When the lines climb above the $80$ threshold, the asset is entering a major overbought zone. Conversely, when the lines plunge below the $20$ line—as highlighted during the deep market corrective phases on the attached chart—it flags an oversold state. A clean, bullish crossover where the light blue line snaps back above the red line provides an objective visual confirmation that the liquidation phase has exhausted.
Developing a Rule-Based Technical System
The Slow KD indicator serves as an exceptional execution engine for both trend-continuation and mean-reversion strategies. For maximum consistency, a trader can wait for price action to pull back into a known institutional support zone or demand block.
Once price tests the level, you simply check your Slow KD sub-window. If the indicator prints a crisp crossover within the oversold pocket, it delivers a data-backed, tight-risk entry signal. By taking the guesswork out of momentum scanning, this tool empowers you to trade with absolute emotional discipline.
2 Downloads
Last Update:
May 24, 2026 02:17 AM
Published:
Jan 15, 2026 19:54 PM
Category: