Mastering Market Squeezes with the Roofing Stochastic Indicator
In technical financial analysis, traditional momentum oscillators like standard Stochastics or the Relative Strength Index (RSI) are highly celebrated for finding turning points in range-bound markets. However, when an asset enters an aggressive, structural macro trend, these classic tools suffer from a major mathematical flaw: they get stuck. They pin themselves inside extreme overbought or oversold zones for extended periods, producing a series of false reversal signals that can devastate a trader's account. To solve this baseline limitation, advanced digital signal processing (DSP) principles were introduced to the trading world, resulting in the Roofing Stochastic indicator.
Download Roofing Stochastic for free. Master market cycle timing and eliminate false oscillator signals with this advanced roofing filter.
What is the Roofing Stochastic Indicator?
The Roofing Stochastic is a next-generation momentum oscillator built on the pioneering research of legendary technical analyst John Ehlers. It filters out the distorting effects of market noise and macro trend extensions by combining a unique mathematical framework known as a Roofing Filter with a traditional stochastic evaluation.
Before calculating oscillator extremes, the algorithm applies a zero-mean, low-pass roofing filter to the underlying price data. This mathematical processing step strips away low-frequency trend components and high-frequency noise, isolating the clean, repeating cyclical waves of the market. By running a stochastic calculation on this perfectly detrended dataset, the indicator stays mathematically stable, preventing the line from pinning or lagging at trend extremes.
Decoding the Sub-Window Visuals
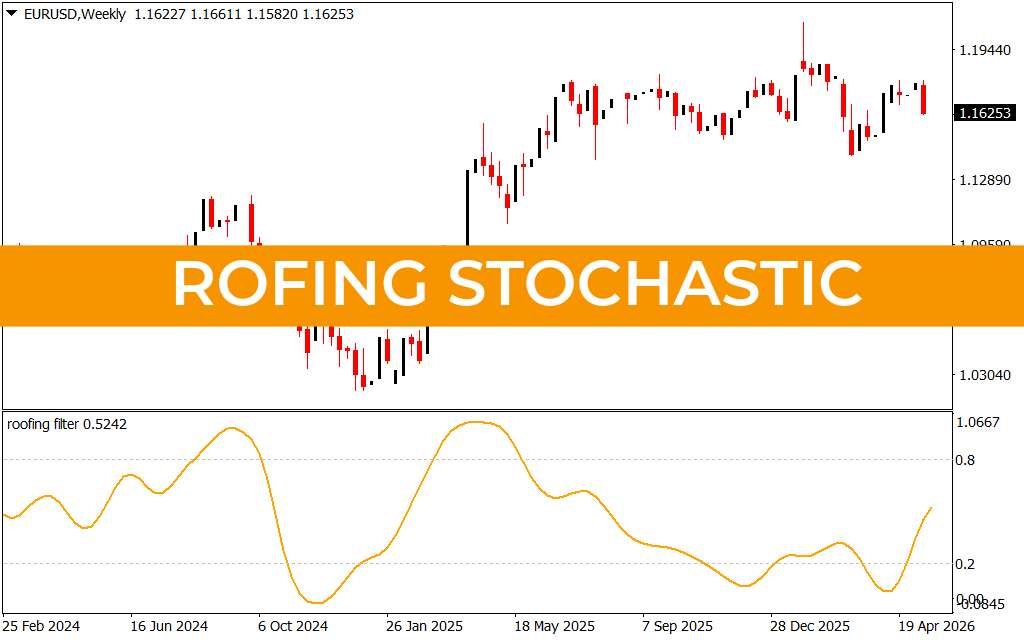
As demonstrated on a long-term macro weekly (Weekly) chart for major currency pairs like the EUR/USD, the Roofing Stochastic populates a clean standalone window below the primary price candlesticks:
- The Cycle Line (Dynamic Orange Wave): The indicator tracks market velocity as a highly responsive, smoothed line moving fluidly between its boundaries. Unlike standard choppy oscillators, this DSP wave charts clean, predictable arcs.
- The Overbought Boundary ($0.80$): When the orange wave climbs above the $0.80$ threshold, it highlights a cyclical peak where short-term buying pressure is mathematically exhausted. This warns technical analysts to manage risk on long positions or watch for trend-reversal setups.
- The Oversold Boundary ($0.20$): Conversely, when the wave slips beneath the $0.20$ threshold, it reveals a structural cycle trough. This alerts traders to an impending influx of buying volume, signaling a prime accumulation area.
Professional Strategic Applications
To exploit the structural math of the Roofing Stochastic indicator inside your trading terminal, execute it with systematic filters:
- Cycle Turn Reversals: Do not execute a trade the moment the line enters an extreme boundary. Instead, wait for the orange line to clearly hook and cross back inside the channel (e.g., crossing back above $0.20$ from underneath). This serves as your active momentum validation trigger.
- Macro Trend Confluence: Use the Roofing Stochastic to time entries in the direction of the macro trend. If your primary Market Structure is heavily bullish, ignore overbought signals entirely. Use deep oversold dips below $0.20$ as high-probability pullback entries.
By transforming raw Price Action into clean, predictable cycles, the Roofing Stochastic indicator removes subjective guesswork, allowing you to execute entries with rule-based confidence.
2 Downloads
Last Update:
May 21, 2026 02:52 AM
Published:
Jan 18, 2026 13:36 PM
Category: