The Doji Detector Indicator for MT4 is a powerful and free Forex trading tool designed to scan the financial markets for Doji candlestick patterns. Doji candles are widely recognized as potential signals of market indecision and possible price reversals. With this indicator, traders can quickly and easily identify Doji formations on their charts and take advantage of high-probability trading opportunities.
This indicator is especially useful for traders who rely on Price Action and candlestick analysis, as it removes the need for manual chart scanning and highlights Doji candles automatically.
What Is a Doji Candlestick Pattern
A Doji candlestick forms when the opening and closing prices are nearly equal, resulting in a candle with a very small body. This pattern reflects market indecision, where neither buyers nor sellers have full control.
Doji patterns often appear near key Support And Resistance levels or at the end of strong trends, making them valuable signals for potential trend reversals or pauses.
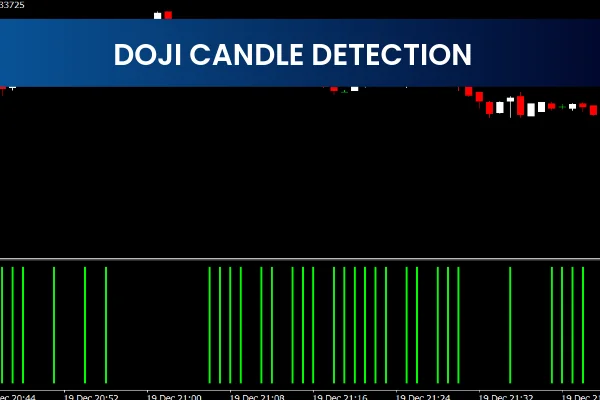
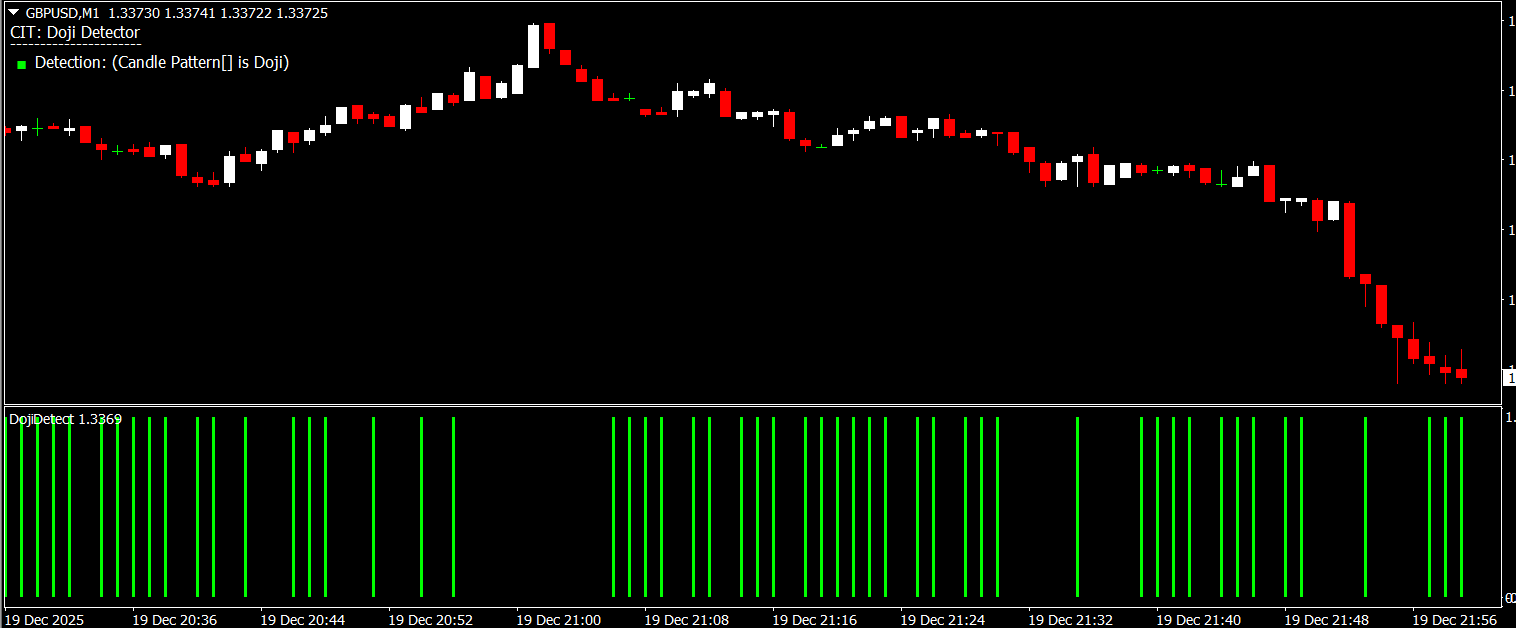
How the Doji Detector Indicator for MT4 Works
The Doji Detector Indicator for MT4 continuously scans the chart in real time and identifies Doji candlesticks as they form. When a Doji candle is detected, the indicator marks it clearly on the chart, allowing traders to react quickly.
By automating the detection process, this indicator helps traders focus on trade planning and execution rather than manual analysis.
Identifying Potential Price Reversal Points
One of the main benefits of the Doji Detector Indicator for MT4 is its ability to highlight possible price reversal zones.
Bullish Reversal Scenarios
When a Doji forms after a downtrend, it may indicate that selling pressure is weakening. Traders often watch for bullish confirmation candles following the Doji to enter buy trades.
Bearish Reversal Scenarios
When a Doji appears after a strong uptrend, it can signal exhaustion among buyers. A bearish confirmation candle after the Doji may present a selling opportunity.
The indicator helps traders spot these scenarios quickly and efficiently.
Using the Indicator in Trading Strategies
The Doji Detector Indicator for MT4 works best when combined with other technical analysis tools. Traders commonly use it alongside:
Support and resistance levels
Trendlines
Moving averages
Momentum indicators
Using confirmation tools helps reduce false signals and improves overall trade accuracy.
Ideal Timeframes and Market Conditions
This indicator can be used on all timeframes, from Scalping on lower charts to swing trading on higher timeframes. Higher timeframes generally provide stronger and more reliable Doji signals, while lower timeframes offer more frequent opportunities.
The indicator performs well in trending markets near exhaustion points and in ranging markets at key price levels.
Easy Installation and User-Friendly Design
Installing the Doji Detector Indicator for MT4 is quick and simple. After downloading and adding it to your MT4 platform, it immediately begins scanning the chart for Doji candlestick patterns.
No complex configuration is required, making it suitable for both beginner and advanced traders.
Why Traders Use the Doji Detector Indicator
Traders prefer this indicator because it saves time, improves accuracy, and enhances price action analysis. It ensures that no Doji candlestick goes unnoticed and helps traders remain disciplined by focusing on high-quality setups.
Because it is free and lightweight, it is a valuable addition to any MT4 trading toolkit.
Final Thoughts
The Doji Detector Indicator for MT4 is an essential tool for traders who want to identify Doji candlestick patterns and potential price reversals with ease. By automating candlestick detection, it allows traders to focus on strategy and execution.
Download it for free and explore more professional MT4 indicators and trading tools by visiting IndicatorForest.com today.
FAQ
2 Downloads
Published:
Dec 21, 2025 01:04 AM
Category: