The Donchian Bands Indicator for MT4 is an advanced and customized version of the classic Donchian Channel. It applies three moving average lines—the upper, lower, and middle bands—to track market direction and identify potential reversal zones.
While the original Donchian Channel focuses primarily on the highest and lowest prices, this enhanced version offers a smoother, more adaptive view of trend strength and momentum shifts.
Whether you trade forex, stocks, or commodities, the Donchian Bands Indicator provides valuable insight into trend continuation, breakout levels, and support/resistance zones.
👉 Download the Donchian Bands Indicator for MT4 free from IndicatorForest.com and start spotting high-probability trade setups today.
How the Donchian Bands Indicator Works
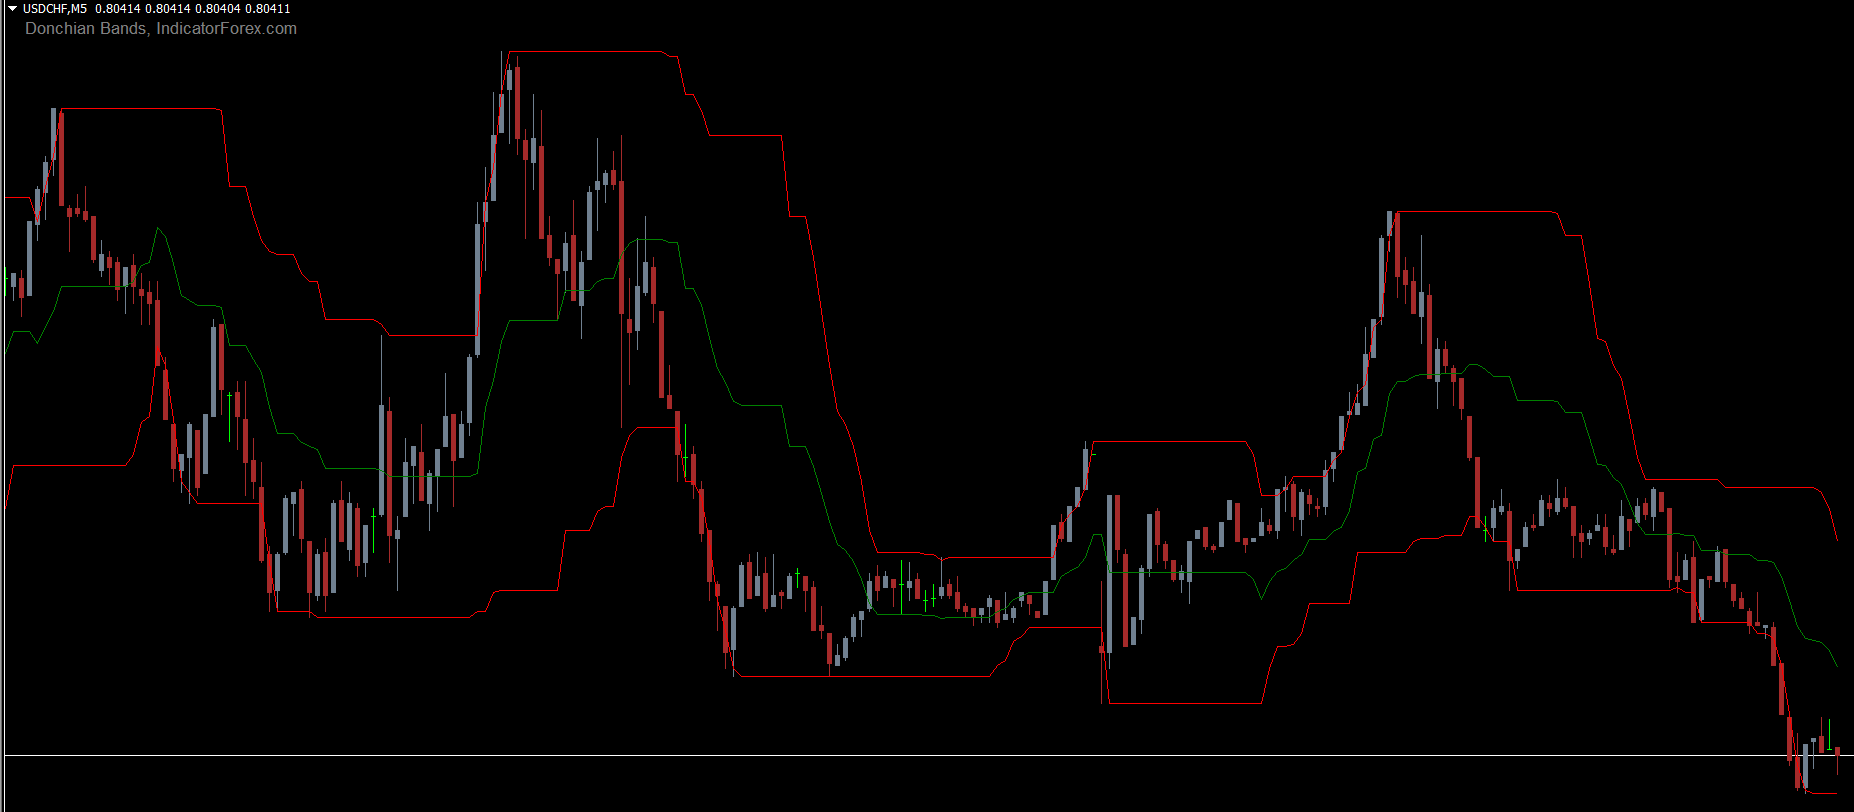
The indicator plots three dynamic bands on your chart:
Upper Band: Represents the recent highest price over a specific period.
Lower Band: Represents the recent lowest price over the same period.
Middle Band: Calculates the midpoint between the upper and lower bands.
Together, these three lines create a price envelope that helps traders assess market volatility and potential breakout levels.
When price moves toward the upper or lower bands, it signals increased volatility and potential Trend Continuation or reversal zones.
How to Use the Donchian Bands Indicator for MT4
The chart above (USD/JPY, H4 timeframe) demonstrates how the Donchian Bands Indicator generates BUY and SELL signals.
BUY Signal (Go Long)
When the price breaks below the lower band, it may indicate a bullish reversal opportunity.
The lower band can also act as a support level, suggesting buyers may soon regain control.
SELL Signal (Go Short)
When the price breaks above the upper band, it often signals a bearish reversal.
The upper band can act as a resistance level, where sellers start to dominate the market.
⚙ Middle Band as Neutral Zone
The middle band serves as a neutral level or a trend divider.
If the price moves significantly away from it, the trend is considered strong.
When price returns toward the middle band, it can signal a potential retracement or consolidation.
💡 Pro Tip: The Donchian Bands work best in trending conditions. Avoid using it during sideways or choppy markets. Combine it with confirmation tools like RSI or MACD to validate entry signals.
Recommended Settings and Usage Tips
Best Timeframes: H1, H4, and Daily
Recommended Pairs: EUR/USD, GBP/USD, USD/JPY
Trading Style: Swing and Intraday Trading
Best Confirmation Tools: RSI, MACD, or Moving Average Crossovers
Advantages of Using the Donchian Bands Indicator
Detects overbought and oversold market conditions
Works across multiple asset classes (forex, stocks, indices)
Identifies clear breakout zones
Highlights Support And Resistance dynamically
Suitable for both beginners and professional traders
Conclusion
The Donchian Bands Indicator for MT4 offers a modern and effective twist on the traditional Donchian Channel. By adding a middle band, this indicator gives traders a more comprehensive view of Trend Strength, volatility, and reversal potential.
It’s ideal for identifying breakouts, reversals, and trend continuation setups across all timeframes. For best results, use it alongside complementary indicators like RSI or EMA.
✅ Download the Donchian Bands Indicator for MT4 for free at IndicatorForest.com and start improving your trading strategy today!
FAQ
3 Downloads
Published:
Nov 11, 2025 00:52 AM
Category: