The Double Fib Indicator is a popular and free Forex tool for the MetaTrader 4 (MT4) platform. Designed to help traders identify key support and resistance levels, this indicator also highlights potential entry and exit points, making it a valuable addition to any trading strategy. By using dual Fibonacci retracements, the Double Fib Indicator provides a clear visual framework for analyzing Price Action.
How the Double Fib Indicator Works
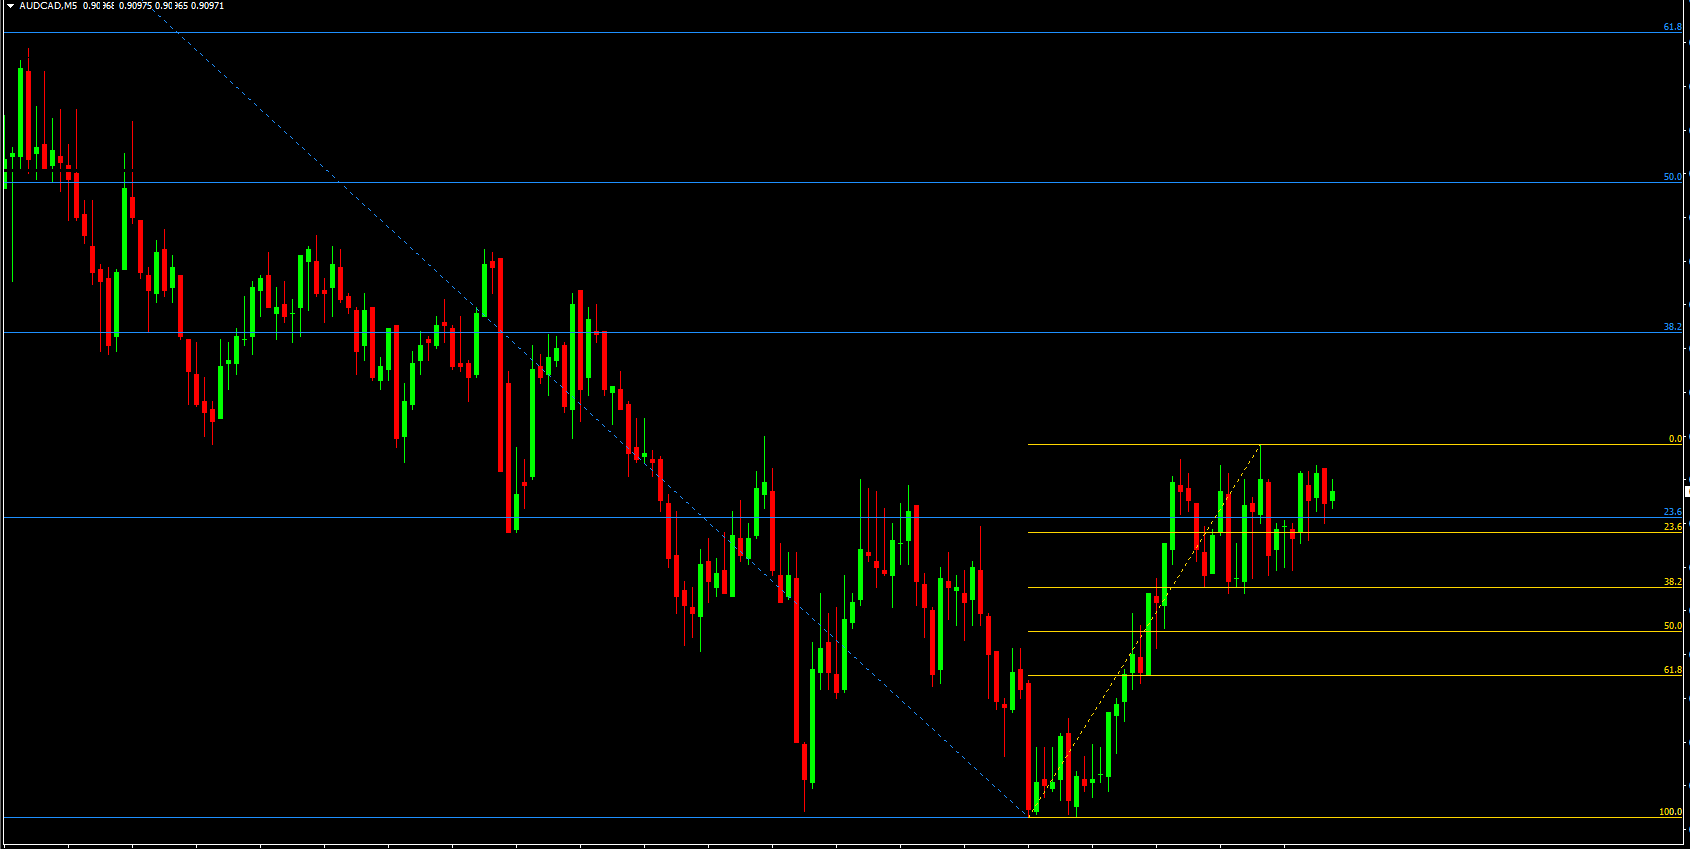
The Double Fib Indicator works by plotting two Fibonacci retracements on the chart:
The first Fibonacci retracement is based on the trend most recent high and low points.
The second Fibonacci retracement is based on the highest high and lowest low over the past two to three weeks.
By combining these two retracements, the indicator allows traders to quickly identify overlapping areas of Support And Resistance, which are often zones where price is likely to react.
Key Features of the Double Fib Indicator
The Double Fib Indicator includes several features signal that make it a practical tool for MT4 traders:
Plots two Fibonacci retracements on the chart for enhanced analysis
Identifies potential support and resistance levels
Highlights potential entry and exit points for trades
Works on all MT4 timeframes and currency pairs
Free and easy to install on MT4
Helps traders plan stop-loss and take-profit levels
Suitable for Scalping, day trading, and swing trading
These features allow traders to gain better insight into market structure and make more informed trading decisions.
Benefits of Using the Double Fib Indicator
The Double Fib Indicator provides several advantages for Forex traders:
Helps identify strong support and resistance zones for potential price reversals
Provides a clear visual representation of market levels for trade planning
Assists in determining entry and exit points with more precision
Reduces guesswork by combining short-term and medium-term Fibonacci levels
Supports multiple trading strategies, including Trend Following and range trading
By using this indicator, traders can maximize their trading efficiency and improve overall performance in the Forex market.
How Traders Can Use the Double Fib Indicator Effectively
To use the Double Fib Indicator effectively:
Identify overlapping zones of the two Fibonacci retracements as key support or resistance levels
Enter long trades near support zones and target the nearest resistance level
Enter short trades near resistance zones and target the nearest support level
Combine the indicator with other tools like moving averages, oscillators, or trend indicators for confirmation
Use the Fibonacci levels to plan stop-loss and take-profit points to manage risk
This approach allows traders to make data-driven trading decisions based on historical price action and market structure.
Why the Double Fib Indicator Is Popular
The Double Fib Indicator is widely used because it simplifies the process of identifying critical price levels. By plotting two Fibonacci retracements, it helps traders quickly visualize key areas of support and resistance without manually calculating multiple levels. Its simplicity and effectiveness make it a favorite among MT4 traders of all experience levels.
Overall, the Double Fib Indicator is a valuable MT4 tool for traders looking to enhance their analysis, identify potential trade zones, and improve trading performance.
Download the Double Fib Indicator today from IndicatorForest.com and leverage dual Fibonacci retracements to make smarter Forex trading decisions.
FAQ
Double Fib automatically plots two Fibonacci retracements—one from the most recent swing and one from a larger range—so you can see overlapping support and resistance zones. These confluence areas often mark strong reaction points.
Zones where both retracements cluster together can be used as potential entry areas or profit targets. For example, you might buy near a dual support cluster in an uptrend and take profits near a dual resistance cluster.
It works well from intraday charts up to daily or weekly. Higher‑timeframe Fibonacci levels tend to be more significant, so many traders align lower‑timeframe trades with these broader zones.
No. While Fibonacci can highlight important price areas, it should be combined with confirmation from trend analysis, candlestick patterns or momentum indicators. This helps avoid acting on every level blindly.
Place stop‑loss orders just beyond key confluence zones and size positions so that a loss remains within your risk tolerance. Using the Fib structure to pre‑plan exits and invalidation points supports disciplined trading.
5 Downloads
Published:
Dec 18, 2025 01:55 AM
Category: