Volume analysis is an essential component of technical Forex trading. The Drag and Drop Volume Profile Indicator for MT4 allows traders to visualize market volume distribution across any trading instrument. By plotting volume point of control (POC), high volume nodes (HVN), and low volume nodes (LVN), this indicator helps traders identify key Support And Resistance areas, high and low trading activity zones, and optimal entry points.
This indicator is suitable for both new and advanced traders. Beginners can focus on support and resistance levels for straightforward trade setups, while experienced traders can analyze runaway gap zones and volume nodes to identify precise trading areas.
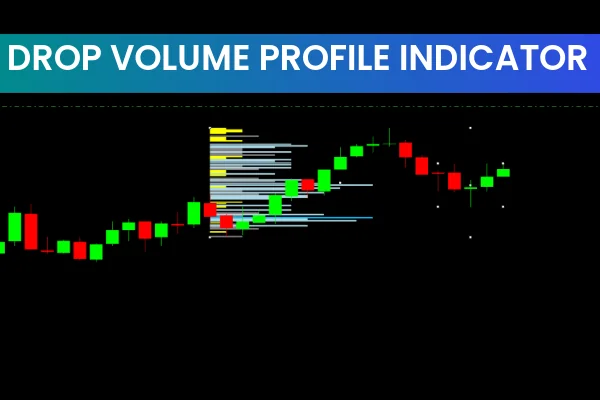
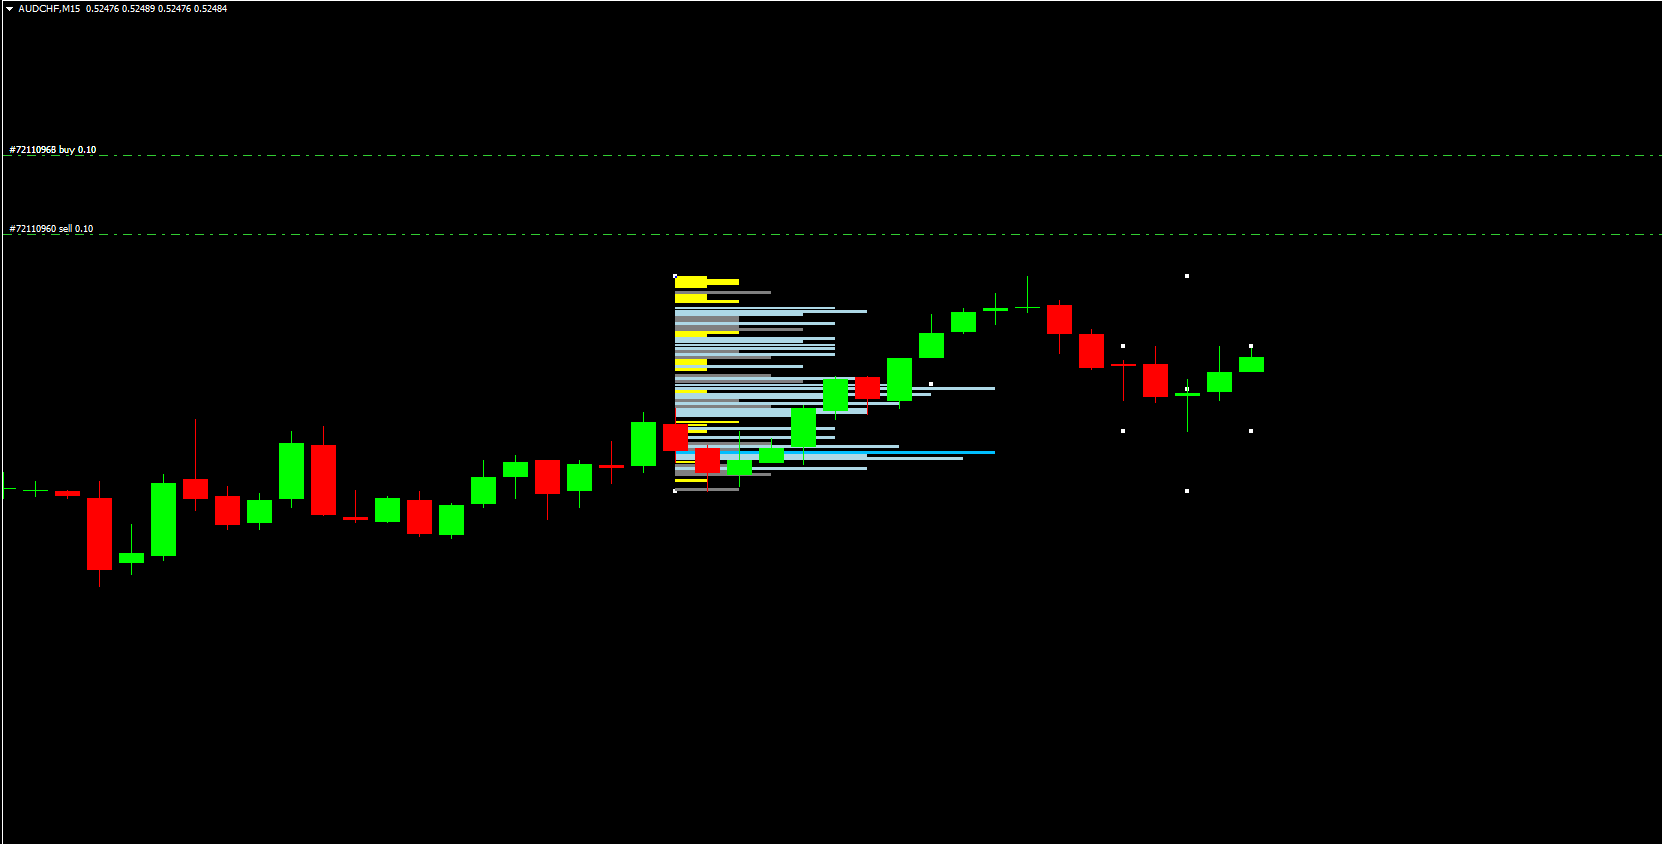
How the Drag and Drop Volume Profile Indicator Works
The indicator builds a volume profile on intraday, daily, weekly, or monthly charts. The visual representation includes:
Point of Control (POC): Highlighted in deep sky blue, this is the price level where the highest volume was traded, acting as strong support or resistance.
Value Area: Shown in light blue, indicating the price range with significant trading activity.
Runaway Gap Zones: Highlighted in yellow, these zones have minimal support/resistance, allowing price to move quickly.
High Volume Nodes (HVN) and Low Volume Nodes (LVN): Represent areas of high and low trading activity, acting as potential support or resistance.
By analyzing the volume profile, traders can identify bullish or bearish conditions based on price relative to the POC:
Bullish Setup: Price crosses above the POC. Enter a BUY trade with a stop loss below the recent swing low and target the next HVN for profit.
Bearish Setup: Price moves below the POC. Enter a SELL trade with a stop above the recent swing high and target the next HVN for profit.
Trading Strategies Using Volume Profile Indicator
Support and Resistance Trading
Use POC, HVN, and LVN to identify strong support and resistance levels.
Place trades at these levels for high-probability entries.
Breakout Trading
Observe price moving through runaway gap zones with minimal resistance.
Enter trades in the direction of the breakout, using HVN levels as potential targets.
Trend Confirmation
Combine volume profile analysis with trend indicators to confirm bullish or bearish momentum.
Enter trades aligned with both trend direction and volume analysis for higher success rates.
This approach helps traders use volume as a key factor in decision-making while avoiding reliance on it as the sole Trend Indicator.
Advantages of Using Drag and Drop Volume Profile Indicator
Visual Volume Analysis: Easily view point of control, value areas, and high/low volume nodes.
Multi-Timeframe Compatibility: Works on intraday and long-term charts.
Support & Resistance Identification: Quickly pinpoint key trading levels.
Beginner and Advanced Friendly: Provides simple guidance for new traders and advanced insights for experienced traders.
Free to Download: Fully accessible for all MT4 users.
By incorporating volume profiles, traders can enhance their technical trading strategies and improve trade timing and risk management.
Conclusion
The Drag and Drop Volume Profile Indicator for MT4 is a powerful tool for technical Forex traders who want to integrate volume analysis into their trading strategies. By identifying POC, HVN, LVN, and runaway gaps, traders can make informed decisions about support, resistance, and entry points.
While volume is an integral part of trading analysis, it should not be used as the sole determinant of trend or direction. Available for free download, this indicator is suitable for both new and advanced traders looking to improve market timing and trade precision.
Visit IndicatorForest.com to download the Drag and Drop Volume Profile Indicator and enhance your MT4 trading strategy today.
FAQ
The Drop Volume Profile Indicator displays volume distribution at different price levels, showing where the most trading activity has occurred. By analyzing volume at each price level, the indicator helps traders identify high-volume nodes (areas of significant trading) and low-volume nodes (areas with less activity), providing insights into potential support and resistance zones.
High-volume nodes often act as strong support or resistance levels where price may react strongly. Low-volume nodes may indicate areas where price can move quickly. The profile shape helps identify value areas where most trading occurs, making these zones significant for trade planning and risk management.
Use high-volume nodes as potential support or resistance levels for entry and exit planning. Price reactions at these nodes often provide high-probability trading opportunities. Low-volume nodes can be used to identify potential breakout zones. Always combine with price action and trend analysis for confirmation.
Volume Profile provides insights into where the market has shown the most interest and trading activity. These high-volume zones often act as significant support or resistance because many traders have transacted at these levels, making them important reference points for future price action.
The indicator works on all MT4 timeframes, though it is particularly effective on higher timeframes (H4, Daily) where volume distribution patterns are clearer and more significant. Lower timeframes may show more noise, making volume profile analysis less reliable without additional confirmation.
27 Downloads
Published:
Dec 14, 2025 22:03 PM
Category: