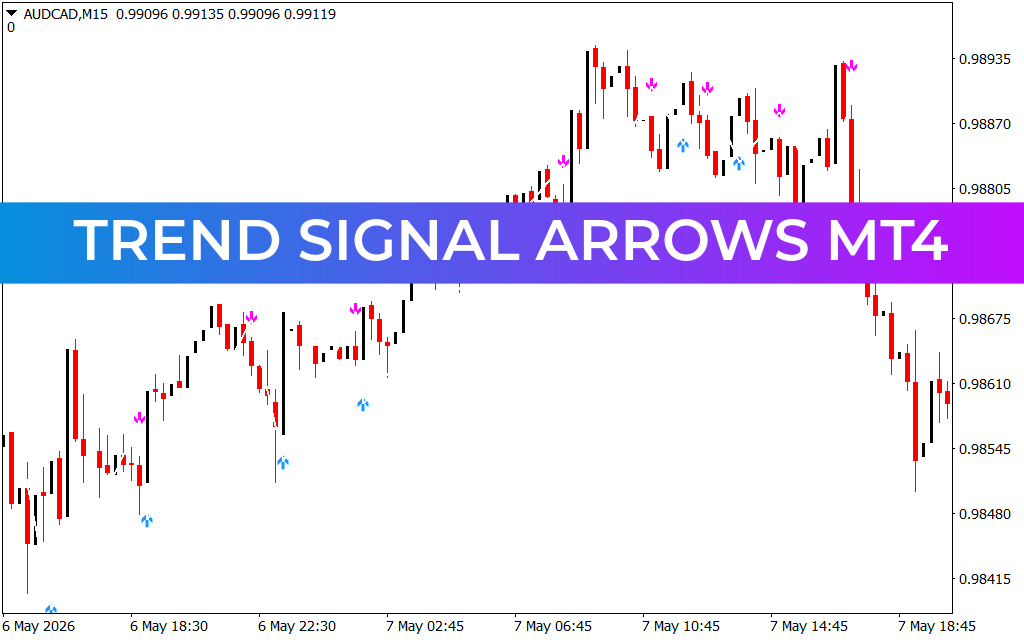
Master Cyclical Reversals with the DSS Bressert Fan Signals Dots Indicator
In modern technical analysis, capturing short-term market turning points within a broader structural trend is the ultimate goal for day traders and scalpers. Traditional oscillators like the Stochastic or the Relative Strength Index (RSI) are highly popular, but they frequently suffer from a fatal flaw: excessive noise and calculation lag. During sharp trend expansions, standard indicators can stay pinned in overbought or oversold conditions for extended periods, triggering costly false reversal entries.
The DSS Bressert Fan Signals Dots indicator eliminates this issue. By applying a double-smoothed exponential calculation to standard momentum data, this premium trading tool isolates true cyclical shifts with minimal lag, rendering pristine visual alerts right on your MetaTrader canvas.
The Science of Double-Smoothed Momentum Tracking
The core edge of the DSS Bressert (Double Smoothed Stochastic) algorithm rests on its multi-layered smoothing process. Developed to track high-velocity market cycles, the software calculates an initial stochastic value and then applies a secondary smoothing formula to that result. This process drastically reduces erratic price spikes while keeping the indicator highly responsive to authentic institutional order flow changes.
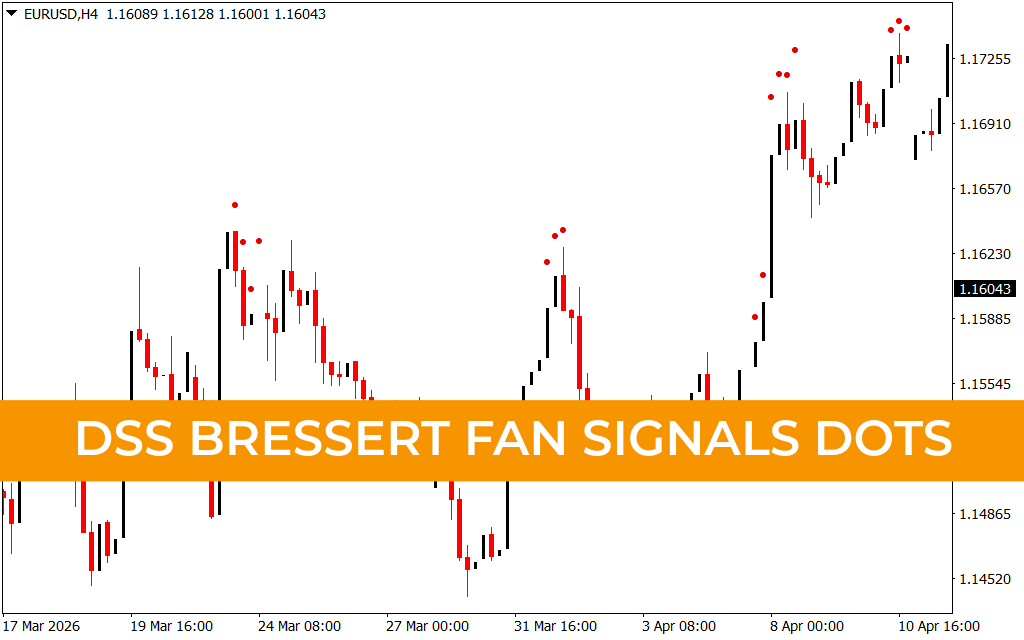
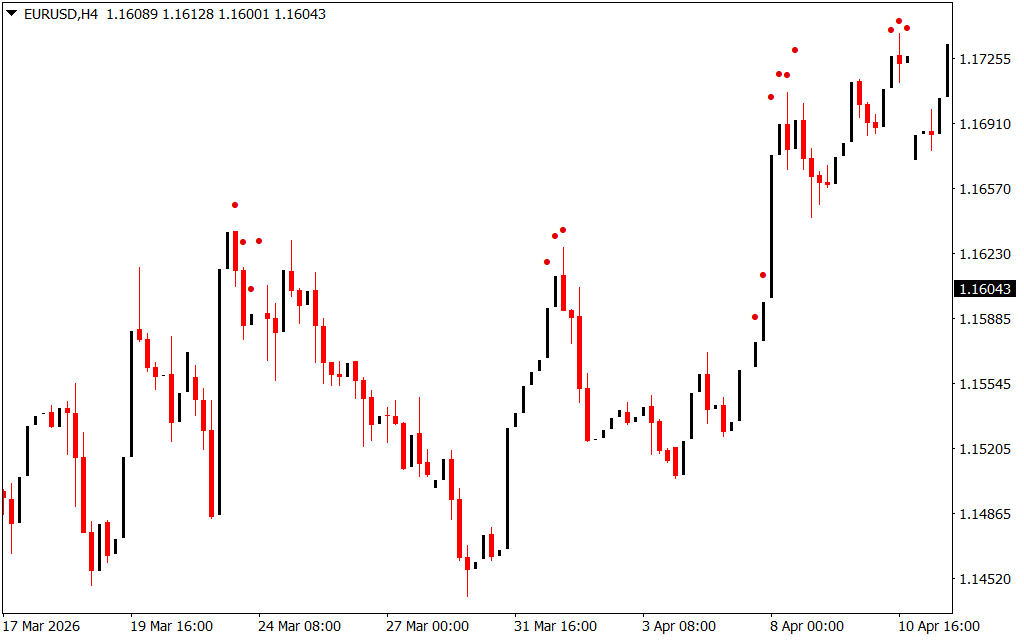
When deployed on liquid currency pairs across structural intervals, such as the 4-hour ($H4$) chart, the indicator transforms complex data into an easy-to-read, actionable technical system:
- On-Chart Operational Dots: Rather than forcing you to constantly split your attention between your candlesticks and a sub-window, this indicator projects real-time execution signals directly onto the main Price Action canvas.
- Bullish Reversal Triggers (Blue Dots): Printed cleanly directly beneath verified candle swing lows, these dots pinpoint structural accumulation zones where seller distribution is drying up. This provides an objective visual signal that an upward bounce is imminent.
- Bearish Exhaustion Alerts (Red Dots): Rendered right above extended swing highs, these markers warn the technical analyst that buying velocity has hit an overextended ceiling, flashing an immediate signal to scale out of long positions or look for short configurations.
Implementing Rule-Based Execution Blueprints
Integrating the systematic visual alerts of the DSS Bressert Fan Signals Dots utility into your daily operation creates an objective trading routine that eliminates emotional hesitation.
1. Trading the Structural Trend Pullback
The most reliable setups occur when an on-chart dot aligns with a larger multi-timeframe trend. For instance, if a currency pair is in a clear macro upward expansion characterized by rising moving averages, aggressive day traders should ignore counter-trend signals and focus exclusively on the appearance of blue dots. Buying the first bullish candle following a blue dot allows you to rejoin the dominant institutional wave at a heavily discounted price point.
2. Mechanical Risk Management Placement
Managing stop-losses with subjective methods often results in premature exits or large, unexpected drawdowns. The DSS Bressert Fan Signals Dots tool solves this operational issue by establishing clear, geometric anchor points. When entering a long position on a verified blue dot setup, the immediate swing low directly beneath that dot serves as a rules-based structural level for your protective stop-loss.
Conclusion
The DSS Bressert Fan Signals Dots indicator is an indispensable workspace upgrade for any systematic trader who values clean charts and reliable trend filters. By replacing traditional, lag-heavy oscillators with accurate, real-time on-chart dot alerts, it takes the guesswork out of volatile market swings. Download the indicator today to optimize your MetaTrader platform and trade structural reversals with absolute precision.
2 Downloads
Last Update:
May 20, 2026 02:30 AM
Published:
Jan 18, 2026 19:39 PM
Category: