Advanced Statistical Analysis: The DT Pirson Q4 Indicator for MT5
In modern financial markets, identifying the underlying structural shifts in Price Action requires tools that go far beyond simple arithmetic averages. Retail traders often face severe drawdowns because traditional technical indicators fail to distinguish random market noise from true, mathematically significant trends. To overcome this limitation, elite day traders look to advanced statistical models to analyze price velocity. The DT Pirson Q4 indicator introduces high-level statistical correlation analysis directly to your MetaTrader 5 (MT5) workspace, providing an objective roadmap of market cycles based on Pearson correlation mathematics.
By tracking how current price movements correlate with idealized, linear trend models, this powerful momentum oscillator helps traders identify major trend reversals and institutional accumulation zones before they show up on standard charting layouts.
The Anatomy of the Statistical Sub-Window
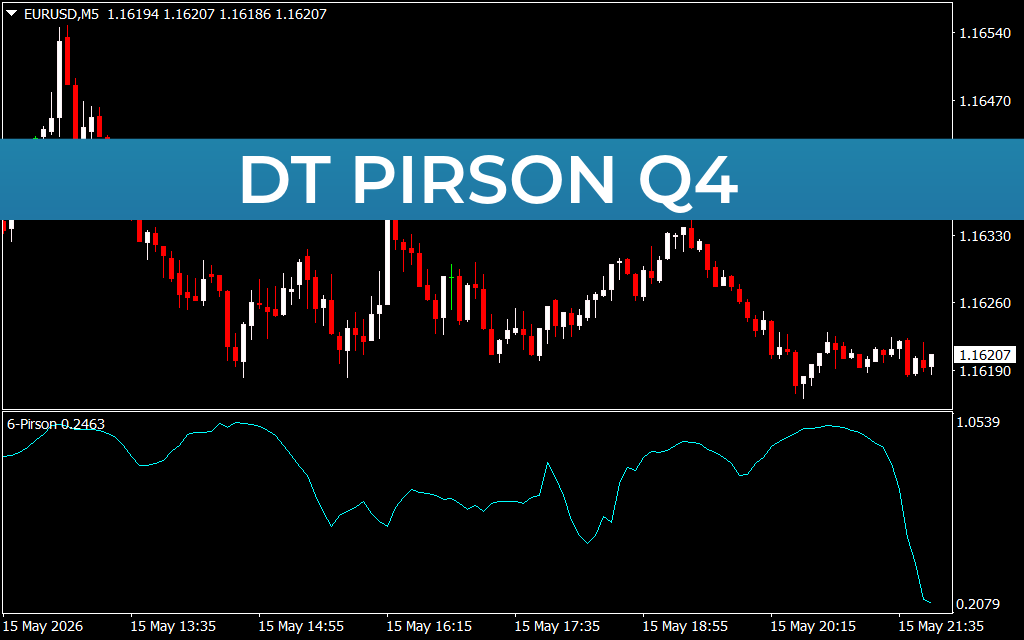
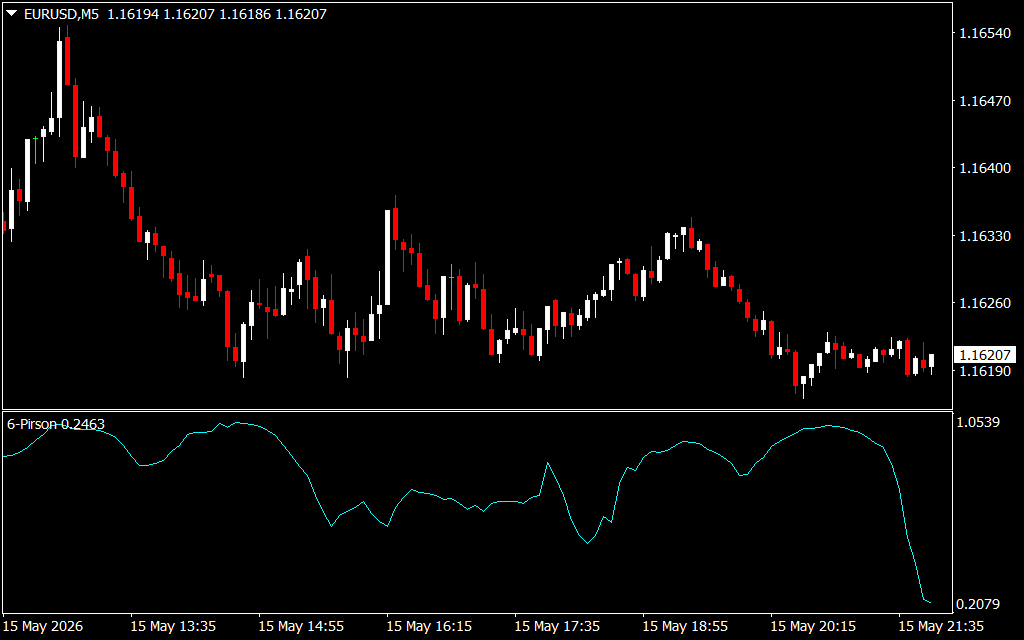
Operating seamlessly out of a dedicated sub-window below your main candlestick screen, the tool translates intricate statistical data into a clean, highly visual curve. When applied to highly liquid pairs like the EUR/USD on a 5-minute (M5) chart, the indicator replaces erratic retail retail signals with an objective, rule-based execution system centered around a dynamic oscillator line:
- The Saturated Distribution Boundary (Upper Threshold): When the light blue oscillator line climbs toward its upper mathematical extreme (near the 1.05 tier), it registers a high degree of positive trend consistency. If the line begins to flatten or hooks sharply downward from this peak, it alerts mean-reversion scalpers that the current bullish cycle is statistically exhausted and ripe for a correction or profit-taking phase.
- The Equilibrium Midline: The central area of the oscillator acts as the ultimate directional filter. When the tracking line crosses decisively through the middle thresholds, it confirms a structural shift in intraday momentum, allowing trend-following traders to join fresh breakouts with mathematical backing.
- The Deep Accumulation Floor (Lower Threshold): Conversely, during heavy market sell-offs, the tracking line drops into its lowest mathematical extreme (near the 0.20 tier). When the oscillator hits this structural floor and begins to curve upward, it unmasks institutional absorption—signaling that large market participants are stepping in to buy the dip, providing a high-probability trigger for long setups.
Optimizing High-Frequency Scalping Systems
The DT Pirson Q4 utility is engineered specifically for fast-paced trading environments, such as 5-minute Scalping and rapid breakout execution systems. It eliminates the standard lag associated with traditional moving averages by evaluating raw mathematical price delivery relative to time.
Instead of guessing whether a sudden intraday drop is an authentic trend change or a temporary institutional liquidity hunt, you check the oscillator. If the line remains anchored near the lower baseline without breaking under it, the bearish momentum is exhausted. By integrating this advanced statistical tool into your trading setup, you can insulate your capital from deceptive market whipsaws and perfectly align your entries with institutional order flow.
2 Downloads
Last Update:
May 17, 2026 16:50 PM
Published:
Jan 20, 2026 16:15 PM
Category: