Unlock Advanced Market Correlation with the DT Pirson Q4 Indicator
In the highly competitive world of Forex and CFD trading, gaining an edge often requires looking beyond standard Price Action. The DT Pirson Q4 Indicator is a sophisticated technical tool designed for MetaTrader 4 that utilizes Pearson Correlation Coefficient mathematics to analyze market cycles and momentum. By identifying the statistical relationship between price movements over a specific period, this indicator helps traders pinpoint exhaustion zones and high-probability reversal points that traditional oscillators might miss.
The Mathematics of Correlation in Trading
The "Pirson" (Pearson) logic is a statistical measure of the linear correlation between two variables. In the context of the DT Pirson Q4 Indicator, it measures the strength and direction of the trend relative to a specific mathematical baseline. Unlike standard RSI or Stochastic oscillators that can remain "pinned" in overbought or oversold territories for extended periods, the DT Pirson Q4 provides a more fluid and responsive reading of market sentiment.
The indicator oscillates within a specific range, creating a visual "wave" that tracks the ebb and flow of market liquidity. When the indicator line reaches its upper or lower extremes, it suggests that the current move is statistically overextended, signaling a high likelihood of a mean reversion or a full Trend Reversal.
Strategic Implementation: Scalping and Beyond
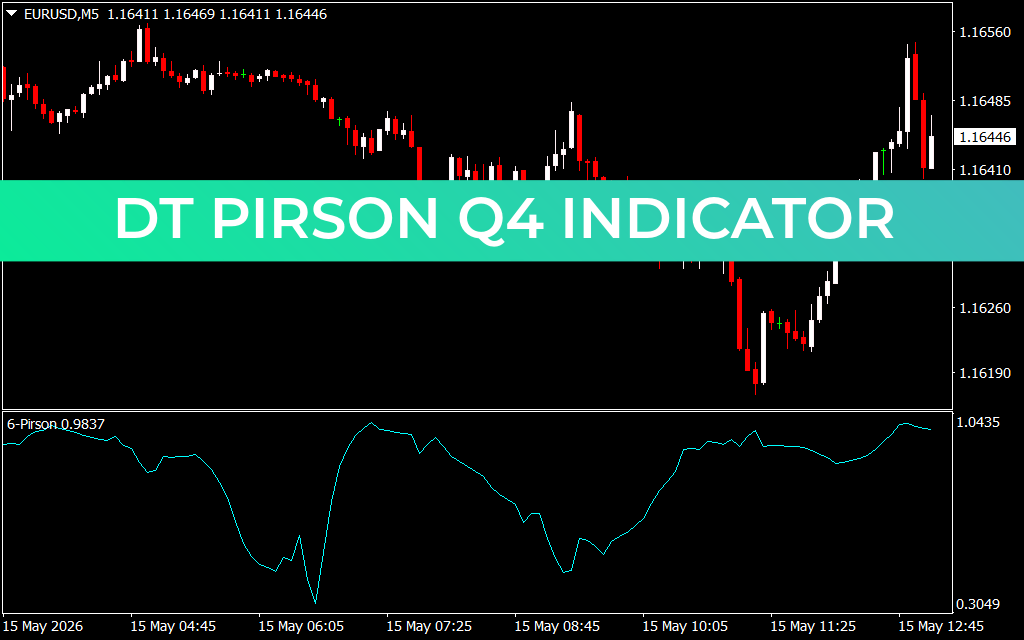
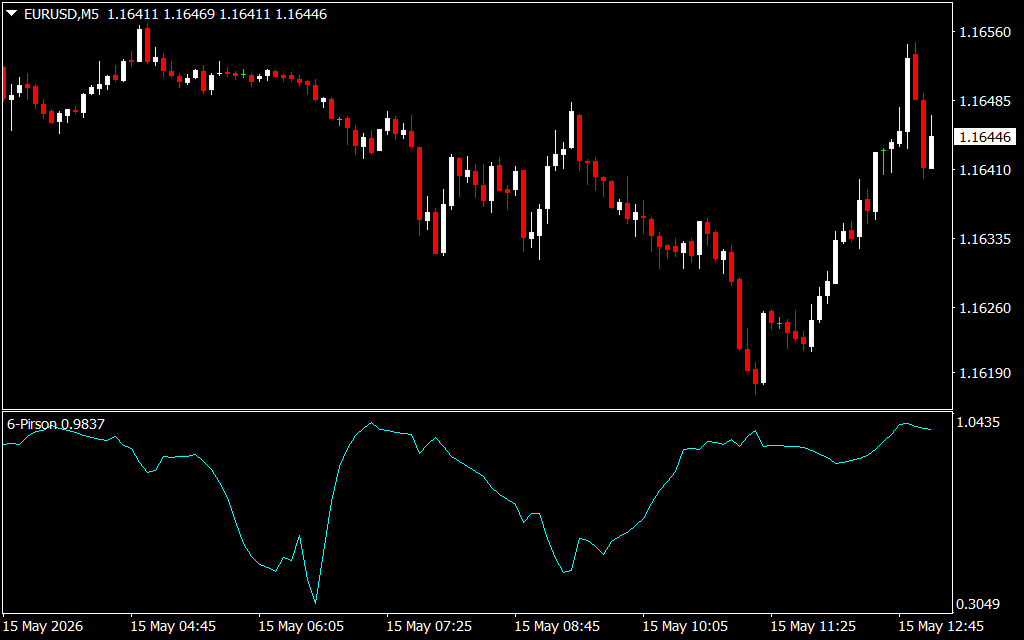
As seen in the EURUSD M5 chart, the DT Pirson Q4 is particularly effective for short-term traders and scalpers. Because it relies on correlation logic rather than simple moving averages, it reacts to price pivots with minimal lag.
- Peak Detection: When the light blue line reaches a cycle peak (as shown near the 0.9837 level in the dashboard), it indicates a period of maximum buying pressure. Smart traders look for price action confirmation, such as a bearish pin bar, to signal a short entry.
- Trough Identification: Conversely, when the line dips into a deep valley, it represents a period of selling exhaustion. This is often the ideal moment to look for long positions before the price begins its recovery.
- Trend Filtering: By observing the slope and position of the Pirson line, traders can determine if the market is in a healthy trend or a chaotic consolidation phase.
Why Choose DT Pirson Q4?
The primary advantage of the DT Pirson Q4 Indicator is its ability to quantify the "quality" of a move. Standard indicators tell you where the price is; the DT Pirson Q4 tells you how consistent that movement is.
- Objective Statistical Analysis: It removes the guesswork by providing a mathematical value (e.g., 0.9837) to represent Trend Strength.
- Clear Visual Interface: The clean, single-line window ensures your workspace remains uncluttered, focusing your attention on the critical turning points.
- Versatility: While highly effective on the 5-minute (M5) timeframe, it is equally robust on higher timeframes like the H1 or H4 for swing trading setups.
For traders looking to move beyond basic technical analysis, the DT Pirson Q4 Indicator offers a professional-grade gateway into the world of statistical market modeling.
1 Download
Last Update:
May 15, 2026 16:11 PM
Published:
Jan 21, 2026 20:19 PM
Category: